Macedonian vs Immigrants from Korea 7th Grade
COMPARE
Macedonian
Immigrants from Korea
7th Grade
7th Grade Comparison
Macedonians
Immigrants from Korea
97.0%
7TH GRADE
99.8/ 100
METRIC RATING
59th/ 347
METRIC RANK
96.0%
7TH GRADE
49.2/ 100
METRIC RATING
177th/ 347
METRIC RANK
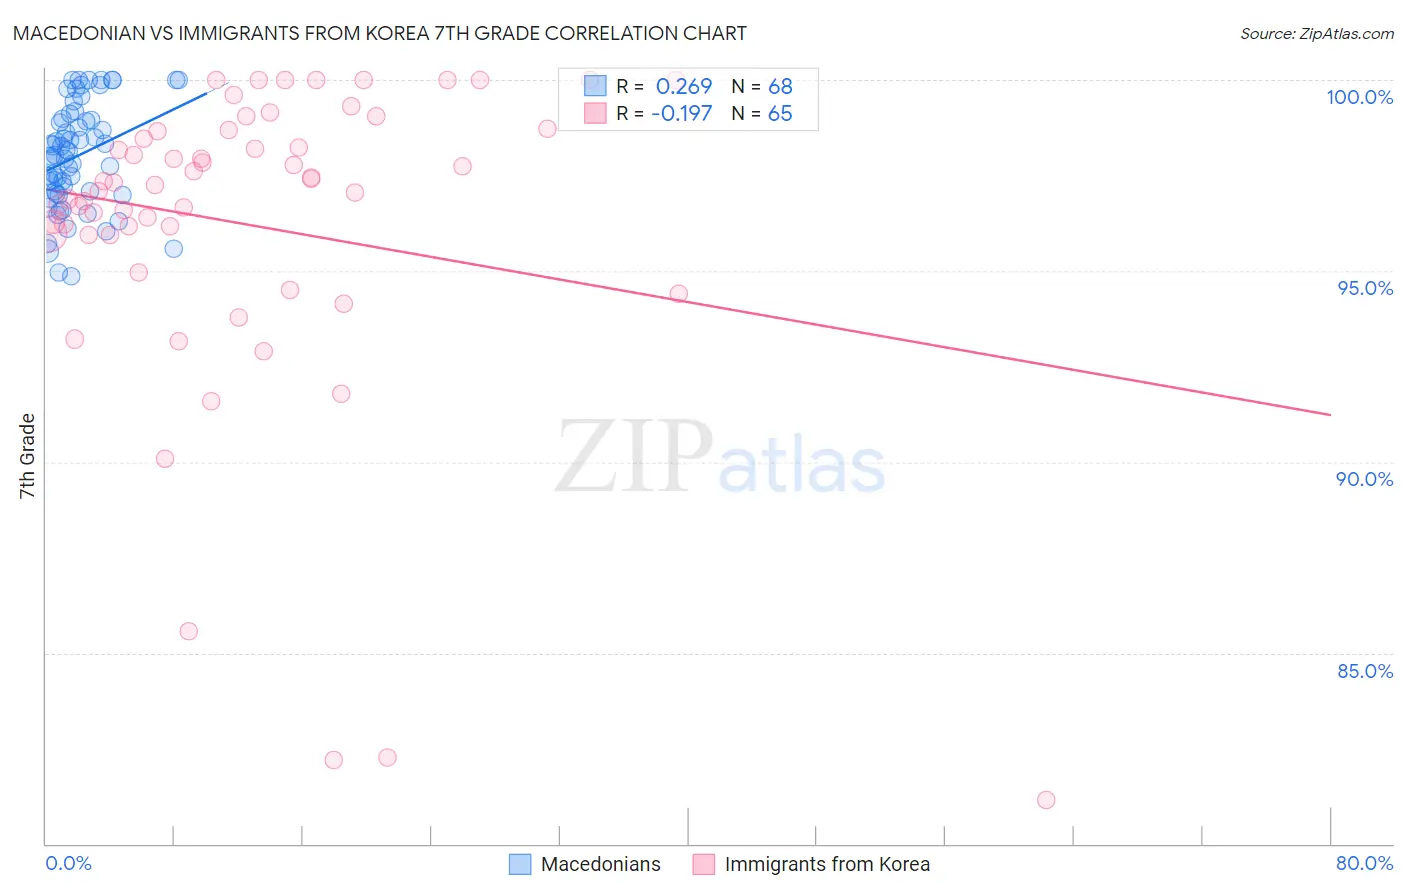
Macedonian vs Immigrants from Korea 7th Grade Correlation Chart
The statistical analysis conducted on geographies consisting of 132,592,860 people shows a weak positive correlation between the proportion of Macedonians and percentage of population with at least 7th grade education in the United States with a correlation coefficient (R) of 0.269 and weighted average of 97.0%. Similarly, the statistical analysis conducted on geographies consisting of 416,280,217 people shows a poor negative correlation between the proportion of Immigrants from Korea and percentage of population with at least 7th grade education in the United States with a correlation coefficient (R) of -0.197 and weighted average of 96.0%, a difference of 0.96%.
7th Grade Correlation Summary
| Measurement | Macedonian | Immigrants from Korea |
| Minimum | 94.9% | 81.1% |
| Maximum | 100.0% | 100.0% |
| Range | 5.1% | 18.9% |
| Mean | 98.0% | 96.2% |
| Median | 98.1% | 97.2% |
| Interquartile 25% (IQ1) | 97.0% | 95.9% |
| Interquartile 75% (IQ3) | 99.0% | 98.7% |
| Interquartile Range (IQR) | 1.9% | 2.7% |
| Standard Deviation (Sample) | 1.4% | 4.1% |
| Standard Deviation (Population) | 1.4% | 4.1% |
Similar Demographics by 7th Grade
Demographics Similar to Macedonians by 7th Grade
In terms of 7th grade, the demographic groups most similar to Macedonians are White/Caucasian (97.0%, a difference of 0.0%), American (97.0%, a difference of 0.010%), Immigrants from Canada (96.9%, a difference of 0.010%), Creek (96.9%, a difference of 0.010%), and Russian (97.0%, a difference of 0.020%).
| Demographics | Rating | Rank | 7th Grade |
| Greeks | 99.9 /100 | #52 | Exceptional 97.0% |
| Austrians | 99.8 /100 | #53 | Exceptional 97.0% |
| Australians | 99.8 /100 | #54 | Exceptional 97.0% |
| Russians | 99.8 /100 | #55 | Exceptional 97.0% |
| Serbians | 99.8 /100 | #56 | Exceptional 97.0% |
| Americans | 99.8 /100 | #57 | Exceptional 97.0% |
| Whites/Caucasians | 99.8 /100 | #58 | Exceptional 97.0% |
| Macedonians | 99.8 /100 | #59 | Exceptional 97.0% |
| Immigrants | Canada | 99.8 /100 | #60 | Exceptional 96.9% |
| Creek | 99.8 /100 | #61 | Exceptional 96.9% |
| Immigrants | North America | 99.8 /100 | #62 | Exceptional 96.9% |
| Immigrants | Northern Europe | 99.7 /100 | #63 | Exceptional 96.9% |
| Immigrants | Austria | 99.7 /100 | #64 | Exceptional 96.9% |
| Canadians | 99.7 /100 | #65 | Exceptional 96.9% |
| Ukrainians | 99.7 /100 | #66 | Exceptional 96.9% |
Demographics Similar to Immigrants from Korea by 7th Grade
In terms of 7th grade, the demographic groups most similar to Immigrants from Korea are Black/African American (96.0%, a difference of 0.0%), Chilean (96.0%, a difference of 0.0%), Marshallese (96.0%, a difference of 0.0%), Venezuelan (96.0%, a difference of 0.010%), and Immigrants from Albania (96.0%, a difference of 0.010%).
| Demographics | Rating | Rank | 7th Grade |
| Immigrants | Ukraine | 55.0 /100 | #170 | Average 96.1% |
| Egyptians | 54.2 /100 | #171 | Average 96.1% |
| Venezuelans | 51.4 /100 | #172 | Average 96.0% |
| Immigrants | Albania | 50.4 /100 | #173 | Average 96.0% |
| Mongolians | 50.0 /100 | #174 | Average 96.0% |
| Blacks/African Americans | 49.5 /100 | #175 | Average 96.0% |
| Chileans | 49.3 /100 | #176 | Average 96.0% |
| Immigrants | Korea | 49.2 /100 | #177 | Average 96.0% |
| Marshallese | 48.4 /100 | #178 | Average 96.0% |
| Immigrants | Iran | 47.8 /100 | #179 | Average 96.0% |
| Immigrants | Brazil | 46.8 /100 | #180 | Average 96.0% |
| Pakistanis | 44.5 /100 | #181 | Average 96.0% |
| Iraqis | 41.2 /100 | #182 | Average 96.0% |
| Immigrants | Spain | 38.8 /100 | #183 | Fair 96.0% |
| Sierra Leoneans | 37.5 /100 | #184 | Fair 96.0% |