Macedonian vs Immigrants from Korea 1st Grade
COMPARE
Macedonian
Immigrants from Korea
1st Grade
1st Grade Comparison
Macedonians
Immigrants from Korea
98.3%
1ST GRADE
98.7/ 100
METRIC RATING
92nd/ 347
METRIC RANK
97.9%
1ST GRADE
53.0/ 100
METRIC RATING
172nd/ 347
METRIC RANK
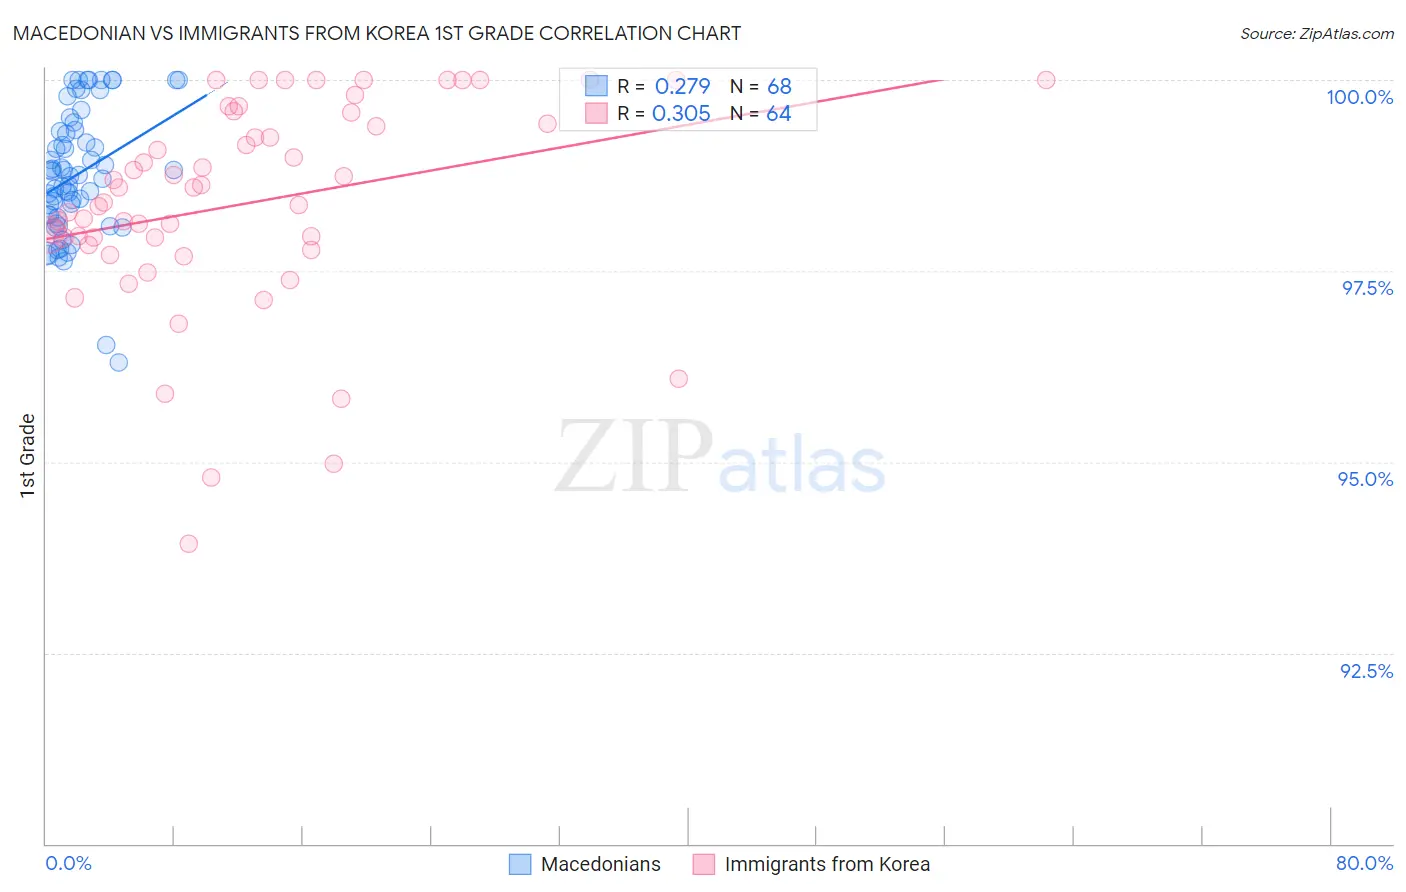
Macedonian vs Immigrants from Korea 1st Grade Correlation Chart
The statistical analysis conducted on geographies consisting of 132,592,860 people shows a weak positive correlation between the proportion of Macedonians and percentage of population with at least 1st grade education in the United States with a correlation coefficient (R) of 0.279 and weighted average of 98.3%. Similarly, the statistical analysis conducted on geographies consisting of 416,280,076 people shows a mild positive correlation between the proportion of Immigrants from Korea and percentage of population with at least 1st grade education in the United States with a correlation coefficient (R) of 0.305 and weighted average of 97.9%, a difference of 0.33%.
1st Grade Correlation Summary
| Measurement | Macedonian | Immigrants from Korea |
| Minimum | 96.3% | 93.9% |
| Maximum | 100.0% | 100.0% |
| Range | 3.7% | 6.1% |
| Mean | 98.8% | 98.4% |
| Median | 98.8% | 98.5% |
| Interquartile 25% (IQ1) | 98.2% | 97.9% |
| Interquartile 75% (IQ3) | 99.3% | 99.5% |
| Interquartile Range (IQR) | 1.1% | 1.6% |
| Standard Deviation (Sample) | 0.83% | 1.4% |
| Standard Deviation (Population) | 0.83% | 1.4% |
Similar Demographics by 1st Grade
Demographics Similar to Macedonians by 1st Grade
In terms of 1st grade, the demographic groups most similar to Macedonians are Immigrants from Western Europe (98.3%, a difference of 0.0%), Zimbabwean (98.3%, a difference of 0.010%), Immigrants from South Africa (98.3%, a difference of 0.010%), Ukrainian (98.3%, a difference of 0.010%), and Immigrants from India (98.2%, a difference of 0.010%).
| Demographics | Rating | Rank | 1st Grade |
| Hopi | 99.0 /100 | #85 | Exceptional 98.3% |
| Immigrants | Denmark | 99.0 /100 | #86 | Exceptional 98.3% |
| Immigrants | Australia | 99.0 /100 | #87 | Exceptional 98.3% |
| Zimbabweans | 98.9 /100 | #88 | Exceptional 98.3% |
| Immigrants | South Africa | 98.8 /100 | #89 | Exceptional 98.3% |
| Ukrainians | 98.8 /100 | #90 | Exceptional 98.3% |
| Immigrants | Western Europe | 98.8 /100 | #91 | Exceptional 98.3% |
| Macedonians | 98.7 /100 | #92 | Exceptional 98.3% |
| Immigrants | India | 98.6 /100 | #93 | Exceptional 98.2% |
| South Africans | 98.6 /100 | #94 | Exceptional 98.2% |
| Immigrants | Germany | 98.5 /100 | #95 | Exceptional 98.2% |
| Cypriots | 98.3 /100 | #96 | Exceptional 98.2% |
| Immigrants | Nonimmigrants | 98.3 /100 | #97 | Exceptional 98.2% |
| Choctaw | 98.3 /100 | #98 | Exceptional 98.2% |
| Puget Sound Salish | 98.2 /100 | #99 | Exceptional 98.2% |
Demographics Similar to Immigrants from Korea by 1st Grade
In terms of 1st grade, the demographic groups most similar to Immigrants from Korea are Immigrants from Jordan (97.9%, a difference of 0.0%), Ugandan (97.9%, a difference of 0.010%), Navajo (97.9%, a difference of 0.010%), Bermudan (97.9%, a difference of 0.010%), and Chilean (97.9%, a difference of 0.010%).
| Demographics | Rating | Rank | 1st Grade |
| Ugandans | 56.9 /100 | #165 | Average 97.9% |
| Navajo | 56.6 /100 | #166 | Average 97.9% |
| Bermudans | 56.3 /100 | #167 | Average 97.9% |
| Chileans | 55.6 /100 | #168 | Average 97.9% |
| Immigrants | Micronesia | 55.3 /100 | #169 | Average 97.9% |
| Immigrants | Spain | 54.9 /100 | #170 | Average 97.9% |
| Immigrants | Jordan | 53.9 /100 | #171 | Average 97.9% |
| Immigrants | Korea | 53.0 /100 | #172 | Average 97.9% |
| Kenyans | 51.2 /100 | #173 | Average 97.9% |
| Natives/Alaskans | 50.0 /100 | #174 | Average 97.9% |
| Immigrants | Sri Lanka | 49.7 /100 | #175 | Average 97.9% |
| Albanians | 49.6 /100 | #176 | Average 97.9% |
| Immigrants | Brazil | 49.1 /100 | #177 | Average 97.9% |
| Immigrants | Venezuela | 47.8 /100 | #178 | Average 97.9% |
| Argentineans | 47.2 /100 | #179 | Average 97.9% |