Macedonian vs Barbadian 7th Grade
COMPARE
Macedonian
Barbadian
7th Grade
7th Grade Comparison
Macedonians
Barbadians
97.0%
7TH GRADE
99.8/ 100
METRIC RATING
59th/ 347
METRIC RANK
95.1%
7TH GRADE
0.1/ 100
METRIC RATING
279th/ 347
METRIC RANK
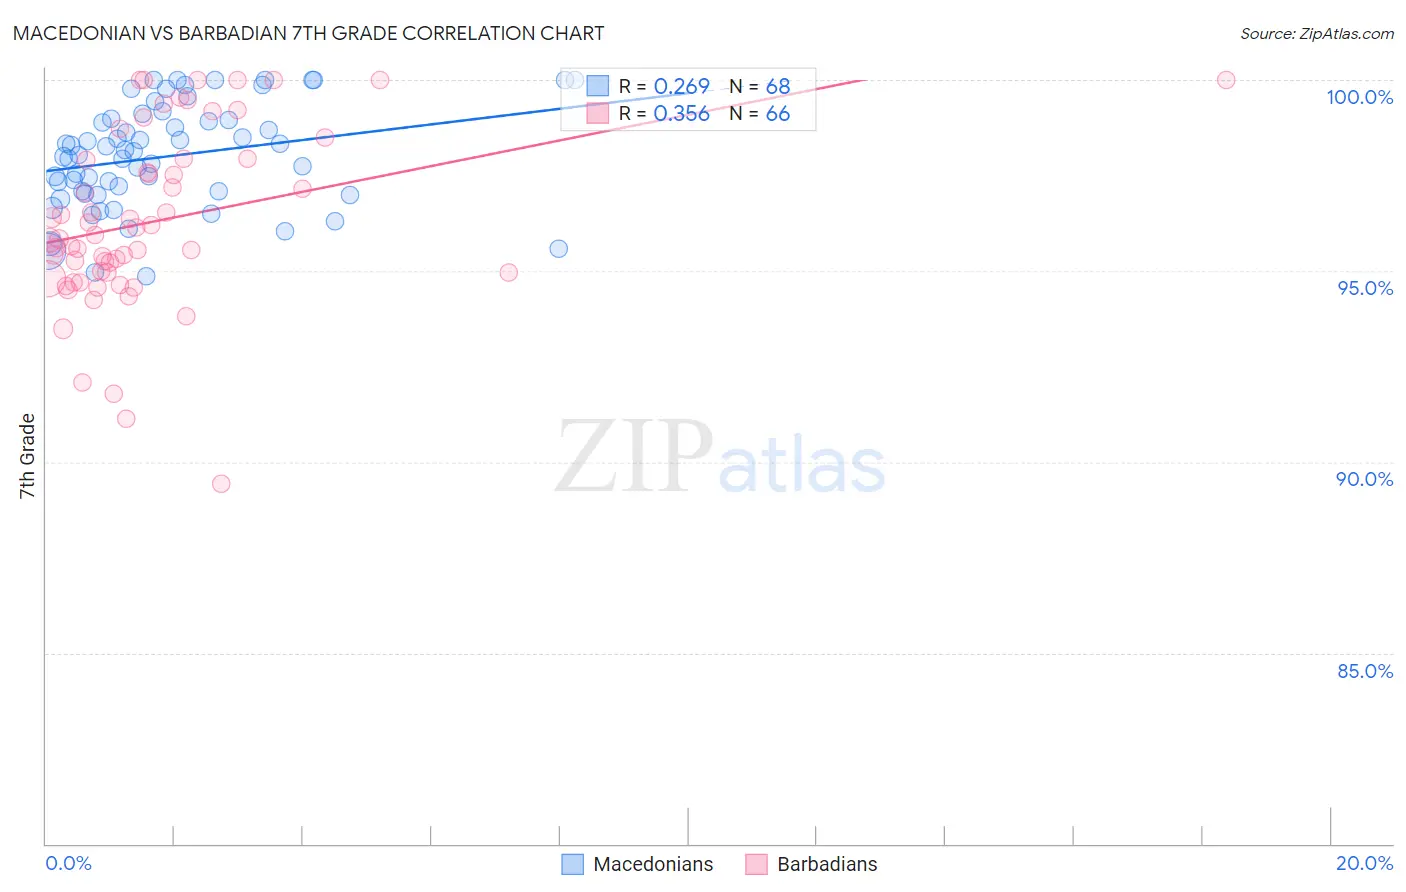
Macedonian vs Barbadian 7th Grade Correlation Chart
The statistical analysis conducted on geographies consisting of 132,592,860 people shows a weak positive correlation between the proportion of Macedonians and percentage of population with at least 7th grade education in the United States with a correlation coefficient (R) of 0.269 and weighted average of 97.0%. Similarly, the statistical analysis conducted on geographies consisting of 141,299,217 people shows a mild positive correlation between the proportion of Barbadians and percentage of population with at least 7th grade education in the United States with a correlation coefficient (R) of 0.356 and weighted average of 95.1%, a difference of 2.0%.
7th Grade Correlation Summary
| Measurement | Macedonian | Barbadian |
| Minimum | 94.9% | 89.4% |
| Maximum | 100.0% | 100.0% |
| Range | 5.1% | 10.6% |
| Mean | 98.0% | 96.3% |
| Median | 98.1% | 95.9% |
| Interquartile 25% (IQ1) | 97.0% | 95.0% |
| Interquartile 75% (IQ3) | 99.0% | 97.9% |
| Interquartile Range (IQR) | 1.9% | 3.0% |
| Standard Deviation (Sample) | 1.4% | 2.3% |
| Standard Deviation (Population) | 1.4% | 2.3% |
Similar Demographics by 7th Grade
Demographics Similar to Macedonians by 7th Grade
In terms of 7th grade, the demographic groups most similar to Macedonians are White/Caucasian (97.0%, a difference of 0.0%), American (97.0%, a difference of 0.010%), Immigrants from Canada (96.9%, a difference of 0.010%), Creek (96.9%, a difference of 0.010%), and Russian (97.0%, a difference of 0.020%).
| Demographics | Rating | Rank | 7th Grade |
| Greeks | 99.9 /100 | #52 | Exceptional 97.0% |
| Austrians | 99.8 /100 | #53 | Exceptional 97.0% |
| Australians | 99.8 /100 | #54 | Exceptional 97.0% |
| Russians | 99.8 /100 | #55 | Exceptional 97.0% |
| Serbians | 99.8 /100 | #56 | Exceptional 97.0% |
| Americans | 99.8 /100 | #57 | Exceptional 97.0% |
| Whites/Caucasians | 99.8 /100 | #58 | Exceptional 97.0% |
| Macedonians | 99.8 /100 | #59 | Exceptional 97.0% |
| Immigrants | Canada | 99.8 /100 | #60 | Exceptional 96.9% |
| Creek | 99.8 /100 | #61 | Exceptional 96.9% |
| Immigrants | North America | 99.8 /100 | #62 | Exceptional 96.9% |
| Immigrants | Northern Europe | 99.7 /100 | #63 | Exceptional 96.9% |
| Immigrants | Austria | 99.7 /100 | #64 | Exceptional 96.9% |
| Canadians | 99.7 /100 | #65 | Exceptional 96.9% |
| Ukrainians | 99.7 /100 | #66 | Exceptional 96.9% |
Demographics Similar to Barbadians by 7th Grade
In terms of 7th grade, the demographic groups most similar to Barbadians are Immigrants from Trinidad and Tobago (95.1%, a difference of 0.010%), Immigrants from St. Vincent and the Grenadines (95.0%, a difference of 0.030%), Tohono O'odham (95.0%, a difference of 0.030%), Immigrants from Afghanistan (95.1%, a difference of 0.040%), and Immigrants from Bolivia (95.0%, a difference of 0.040%).
| Demographics | Rating | Rank | 7th Grade |
| Peruvians | 0.2 /100 | #272 | Tragic 95.1% |
| Immigrants | Uzbekistan | 0.2 /100 | #273 | Tragic 95.1% |
| Immigrants | Western Africa | 0.2 /100 | #274 | Tragic 95.1% |
| Immigrants | Colombia | 0.2 /100 | #275 | Tragic 95.1% |
| Immigrants | Thailand | 0.2 /100 | #276 | Tragic 95.1% |
| Immigrants | Afghanistan | 0.2 /100 | #277 | Tragic 95.1% |
| Immigrants | Trinidad and Tobago | 0.1 /100 | #278 | Tragic 95.1% |
| Barbadians | 0.1 /100 | #279 | Tragic 95.1% |
| Immigrants | St. Vincent and the Grenadines | 0.1 /100 | #280 | Tragic 95.0% |
| Tohono O'odham | 0.1 /100 | #281 | Tragic 95.0% |
| Immigrants | Bolivia | 0.1 /100 | #282 | Tragic 95.0% |
| Immigrants | Barbados | 0.1 /100 | #283 | Tragic 95.0% |
| Armenians | 0.1 /100 | #284 | Tragic 95.0% |
| Immigrants | Eritrea | 0.1 /100 | #285 | Tragic 94.9% |
| Immigrants | Philippines | 0.0 /100 | #286 | Tragic 94.9% |