Immigrants from Cambodia vs Immigrants from Korea 7th Grade
COMPARE
Immigrants from Cambodia
Immigrants from Korea
7th Grade
7th Grade Comparison
Immigrants from Cambodia
Immigrants from Korea
93.7%
7TH GRADE
0.0/ 100
METRIC RATING
319th/ 347
METRIC RANK
96.0%
7TH GRADE
49.2/ 100
METRIC RATING
177th/ 347
METRIC RANK
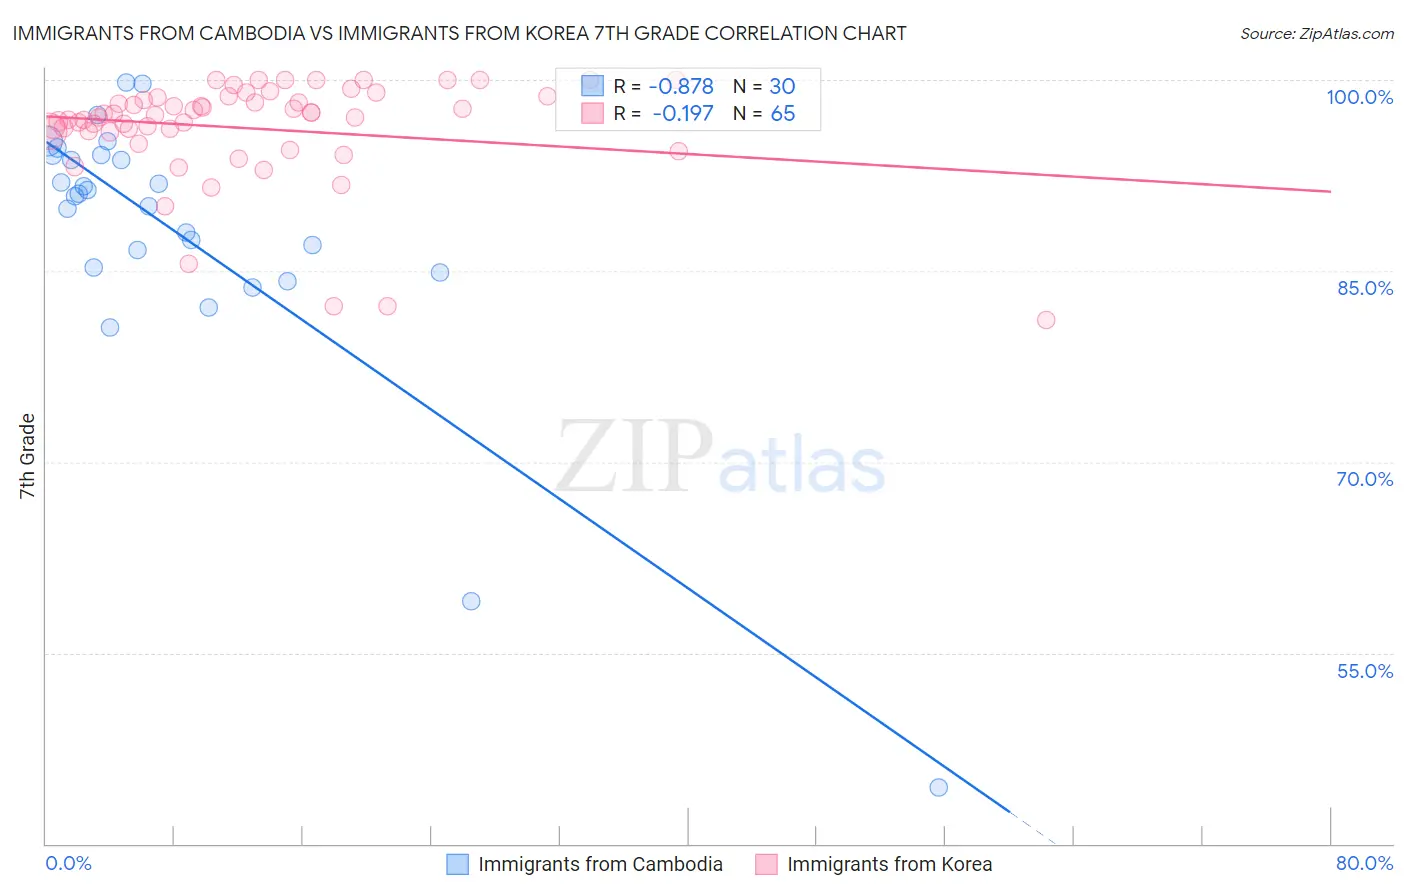
Immigrants from Cambodia vs Immigrants from Korea 7th Grade Correlation Chart
The statistical analysis conducted on geographies consisting of 205,153,442 people shows a very strong negative correlation between the proportion of Immigrants from Cambodia and percentage of population with at least 7th grade education in the United States with a correlation coefficient (R) of -0.878 and weighted average of 93.7%. Similarly, the statistical analysis conducted on geographies consisting of 416,280,217 people shows a poor negative correlation between the proportion of Immigrants from Korea and percentage of population with at least 7th grade education in the United States with a correlation coefficient (R) of -0.197 and weighted average of 96.0%, a difference of 2.5%.
7th Grade Correlation Summary
| Measurement | Immigrants from Cambodia | Immigrants from Korea |
| Minimum | 44.4% | 81.1% |
| Maximum | 99.8% | 100.0% |
| Range | 55.4% | 18.9% |
| Mean | 88.0% | 96.2% |
| Median | 90.9% | 97.2% |
| Interquartile 25% (IQ1) | 85.3% | 95.9% |
| Interquartile 75% (IQ3) | 94.1% | 98.7% |
| Interquartile Range (IQR) | 8.8% | 2.7% |
| Standard Deviation (Sample) | 11.2% | 4.1% |
| Standard Deviation (Population) | 11.0% | 4.1% |
Similar Demographics by 7th Grade
Demographics Similar to Immigrants from Cambodia by 7th Grade
In terms of 7th grade, the demographic groups most similar to Immigrants from Cambodia are Immigrants from Ecuador (93.7%, a difference of 0.030%), Immigrants from Cuba (93.8%, a difference of 0.11%), Immigrants from Fiji (93.5%, a difference of 0.17%), Immigrants from Vietnam (93.9%, a difference of 0.20%), and Belizean (93.5%, a difference of 0.21%).
| Demographics | Rating | Rank | 7th Grade |
| Immigrants | Immigrants | 0.0 /100 | #312 | Tragic 94.0% |
| Immigrants | Bangladesh | 0.0 /100 | #313 | Tragic 94.0% |
| Japanese | 0.0 /100 | #314 | Tragic 94.0% |
| Vietnamese | 0.0 /100 | #315 | Tragic 93.9% |
| Immigrants | Vietnam | 0.0 /100 | #316 | Tragic 93.9% |
| Immigrants | Cuba | 0.0 /100 | #317 | Tragic 93.8% |
| Immigrants | Ecuador | 0.0 /100 | #318 | Tragic 93.7% |
| Immigrants | Cambodia | 0.0 /100 | #319 | Tragic 93.7% |
| Immigrants | Fiji | 0.0 /100 | #320 | Tragic 93.5% |
| Belizeans | 0.0 /100 | #321 | Tragic 93.5% |
| Nicaraguans | 0.0 /100 | #322 | Tragic 93.5% |
| Immigrants | Belize | 0.0 /100 | #323 | Tragic 93.4% |
| Dominicans | 0.0 /100 | #324 | Tragic 93.3% |
| Central American Indians | 0.0 /100 | #325 | Tragic 93.3% |
| Nepalese | 0.0 /100 | #326 | Tragic 93.2% |
Demographics Similar to Immigrants from Korea by 7th Grade
In terms of 7th grade, the demographic groups most similar to Immigrants from Korea are Black/African American (96.0%, a difference of 0.0%), Chilean (96.0%, a difference of 0.0%), Marshallese (96.0%, a difference of 0.0%), Venezuelan (96.0%, a difference of 0.010%), and Immigrants from Albania (96.0%, a difference of 0.010%).
| Demographics | Rating | Rank | 7th Grade |
| Immigrants | Ukraine | 55.0 /100 | #170 | Average 96.1% |
| Egyptians | 54.2 /100 | #171 | Average 96.1% |
| Venezuelans | 51.4 /100 | #172 | Average 96.0% |
| Immigrants | Albania | 50.4 /100 | #173 | Average 96.0% |
| Mongolians | 50.0 /100 | #174 | Average 96.0% |
| Blacks/African Americans | 49.5 /100 | #175 | Average 96.0% |
| Chileans | 49.3 /100 | #176 | Average 96.0% |
| Immigrants | Korea | 49.2 /100 | #177 | Average 96.0% |
| Marshallese | 48.4 /100 | #178 | Average 96.0% |
| Immigrants | Iran | 47.8 /100 | #179 | Average 96.0% |
| Immigrants | Brazil | 46.8 /100 | #180 | Average 96.0% |
| Pakistanis | 44.5 /100 | #181 | Average 96.0% |
| Iraqis | 41.2 /100 | #182 | Average 96.0% |
| Immigrants | Spain | 38.8 /100 | #183 | Fair 96.0% |
| Sierra Leoneans | 37.5 /100 | #184 | Fair 96.0% |