Macedonian vs Immigrants from Israel 7th Grade
COMPARE
Macedonian
Immigrants from Israel
7th Grade
7th Grade Comparison
Macedonians
Immigrants from Israel
97.0%
7TH GRADE
99.8/ 100
METRIC RATING
59th/ 347
METRIC RANK
96.2%
7TH GRADE
77.6/ 100
METRIC RATING
154th/ 347
METRIC RANK
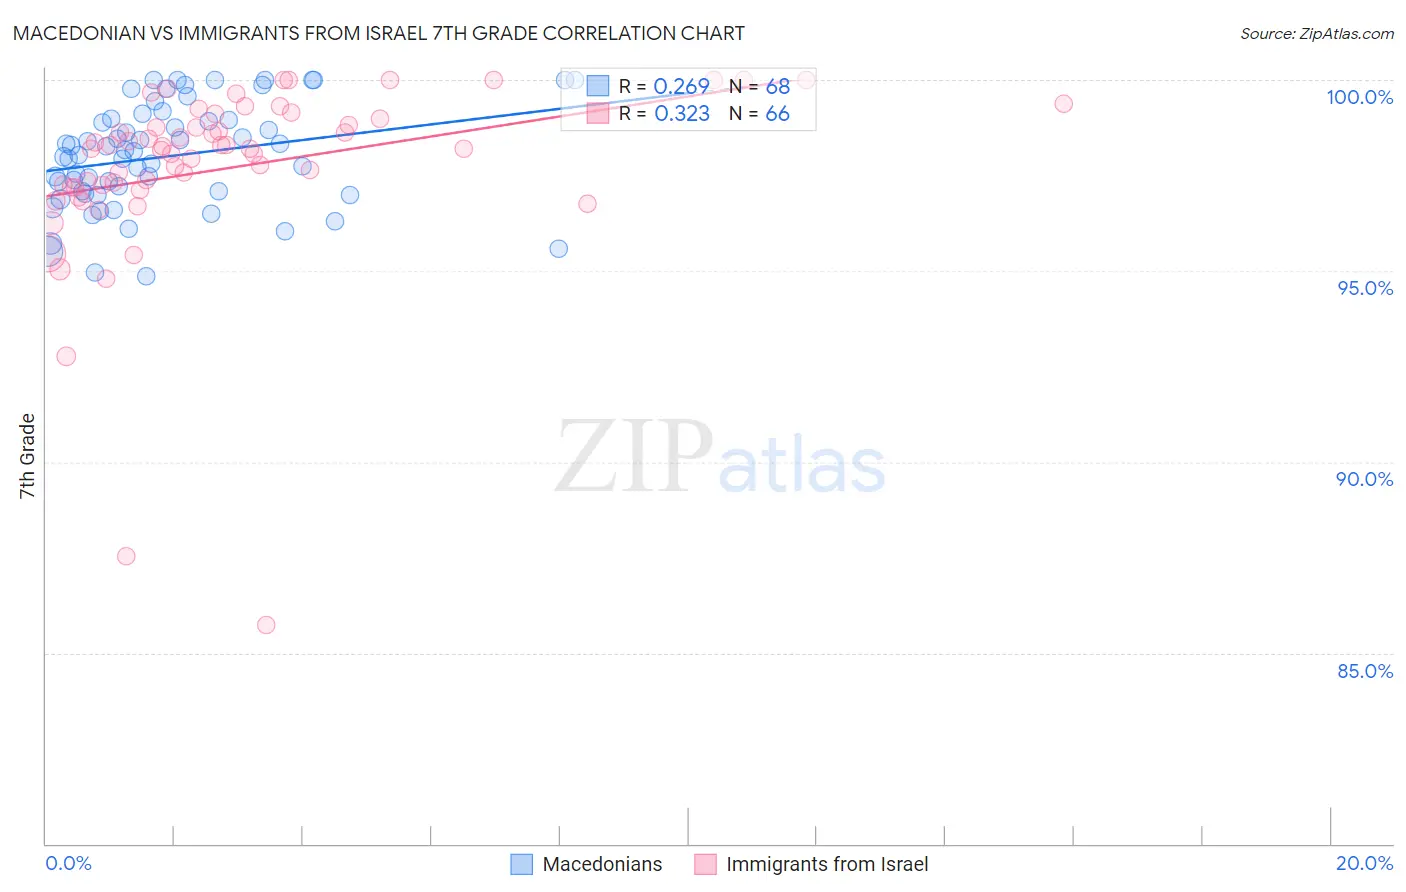
Macedonian vs Immigrants from Israel 7th Grade Correlation Chart
The statistical analysis conducted on geographies consisting of 132,592,860 people shows a weak positive correlation between the proportion of Macedonians and percentage of population with at least 7th grade education in the United States with a correlation coefficient (R) of 0.269 and weighted average of 97.0%. Similarly, the statistical analysis conducted on geographies consisting of 210,030,386 people shows a mild positive correlation between the proportion of Immigrants from Israel and percentage of population with at least 7th grade education in the United States with a correlation coefficient (R) of 0.323 and weighted average of 96.2%, a difference of 0.76%.
7th Grade Correlation Summary
| Measurement | Macedonian | Immigrants from Israel |
| Minimum | 94.9% | 85.7% |
| Maximum | 100.0% | 100.0% |
| Range | 5.1% | 14.3% |
| Mean | 98.0% | 97.7% |
| Median | 98.1% | 98.2% |
| Interquartile 25% (IQ1) | 97.0% | 97.2% |
| Interquartile 75% (IQ3) | 99.0% | 99.0% |
| Interquartile Range (IQR) | 1.9% | 1.8% |
| Standard Deviation (Sample) | 1.4% | 2.4% |
| Standard Deviation (Population) | 1.4% | 2.4% |
Similar Demographics by 7th Grade
Demographics Similar to Macedonians by 7th Grade
In terms of 7th grade, the demographic groups most similar to Macedonians are White/Caucasian (97.0%, a difference of 0.0%), American (97.0%, a difference of 0.010%), Immigrants from Canada (96.9%, a difference of 0.010%), Creek (96.9%, a difference of 0.010%), and Russian (97.0%, a difference of 0.020%).
| Demographics | Rating | Rank | 7th Grade |
| Greeks | 99.9 /100 | #52 | Exceptional 97.0% |
| Austrians | 99.8 /100 | #53 | Exceptional 97.0% |
| Australians | 99.8 /100 | #54 | Exceptional 97.0% |
| Russians | 99.8 /100 | #55 | Exceptional 97.0% |
| Serbians | 99.8 /100 | #56 | Exceptional 97.0% |
| Americans | 99.8 /100 | #57 | Exceptional 97.0% |
| Whites/Caucasians | 99.8 /100 | #58 | Exceptional 97.0% |
| Macedonians | 99.8 /100 | #59 | Exceptional 97.0% |
| Immigrants | Canada | 99.8 /100 | #60 | Exceptional 96.9% |
| Creek | 99.8 /100 | #61 | Exceptional 96.9% |
| Immigrants | North America | 99.8 /100 | #62 | Exceptional 96.9% |
| Immigrants | Northern Europe | 99.7 /100 | #63 | Exceptional 96.9% |
| Immigrants | Austria | 99.7 /100 | #64 | Exceptional 96.9% |
| Canadians | 99.7 /100 | #65 | Exceptional 96.9% |
| Ukrainians | 99.7 /100 | #66 | Exceptional 96.9% |
Demographics Similar to Immigrants from Israel by 7th Grade
In terms of 7th grade, the demographic groups most similar to Immigrants from Israel are Seminole (96.2%, a difference of 0.0%), Immigrants from Jordan (96.2%, a difference of 0.0%), Immigrants from Russia (96.2%, a difference of 0.010%), Kenyan (96.2%, a difference of 0.010%), and Ugandan (96.2%, a difference of 0.020%).
| Demographics | Rating | Rank | 7th Grade |
| French American Indians | 83.1 /100 | #147 | Excellent 96.3% |
| Israelis | 82.8 /100 | #148 | Excellent 96.3% |
| Albanians | 82.6 /100 | #149 | Excellent 96.3% |
| Immigrants | Belarus | 82.4 /100 | #150 | Excellent 96.3% |
| Hopi | 81.6 /100 | #151 | Excellent 96.3% |
| Immigrants | Russia | 78.4 /100 | #152 | Good 96.2% |
| Seminole | 78.1 /100 | #153 | Good 96.2% |
| Immigrants | Israel | 77.6 /100 | #154 | Good 96.2% |
| Immigrants | Jordan | 77.0 /100 | #155 | Good 96.2% |
| Kenyans | 76.2 /100 | #156 | Good 96.2% |
| Ugandans | 75.5 /100 | #157 | Good 96.2% |
| Arabs | 68.6 /100 | #158 | Good 96.2% |
| Alsatians | 67.2 /100 | #159 | Good 96.1% |
| Immigrants | Kenya | 66.8 /100 | #160 | Good 96.1% |
| Bermudans | 66.3 /100 | #161 | Good 96.1% |