Macedonian vs Delaware 11th Grade
COMPARE
Macedonian
Delaware
11th Grade
11th Grade Comparison
Macedonians
Delaware
94.1%
11TH GRADE
99.9/ 100
METRIC RATING
48th/ 347
METRIC RANK
93.0%
11TH GRADE
87.3/ 100
METRIC RATING
134th/ 347
METRIC RANK
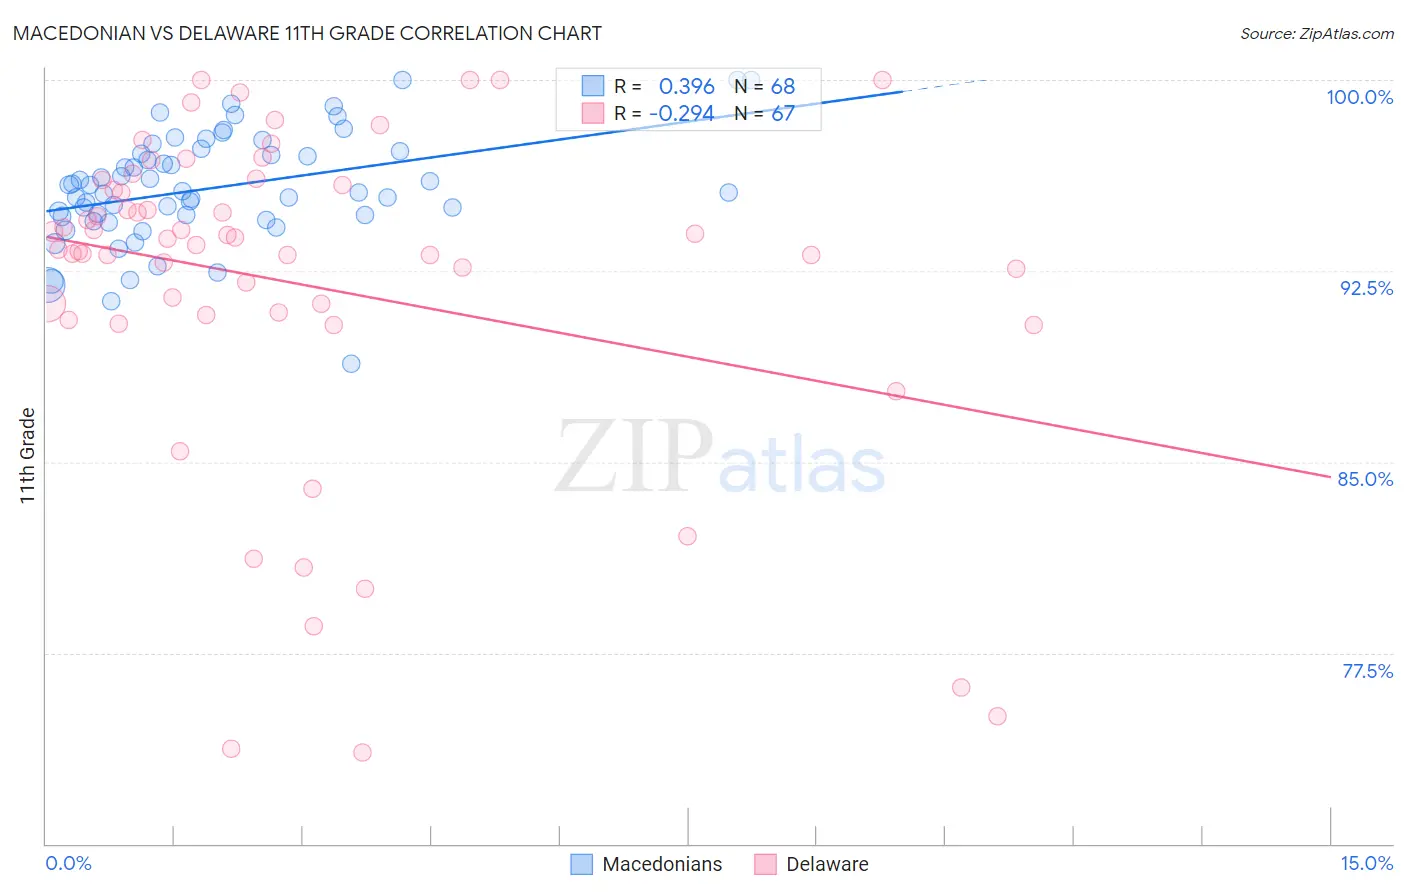
Macedonian vs Delaware 11th Grade Correlation Chart
The statistical analysis conducted on geographies consisting of 132,646,607 people shows a mild positive correlation between the proportion of Macedonians and percentage of population with at least 11th grade education in the United States with a correlation coefficient (R) of 0.396 and weighted average of 94.1%. Similarly, the statistical analysis conducted on geographies consisting of 96,234,866 people shows a weak negative correlation between the proportion of Delaware and percentage of population with at least 11th grade education in the United States with a correlation coefficient (R) of -0.294 and weighted average of 93.0%, a difference of 1.2%.
11th Grade Correlation Summary
| Measurement | Macedonian | Delaware |
| Minimum | 88.9% | 73.6% |
| Maximum | 100.0% | 100.0% |
| Range | 11.1% | 26.4% |
| Mean | 95.8% | 92.0% |
| Median | 95.6% | 93.5% |
| Interquartile 25% (IQ1) | 94.7% | 90.8% |
| Interquartile 75% (IQ3) | 97.1% | 95.9% |
| Interquartile Range (IQR) | 2.5% | 5.1% |
| Standard Deviation (Sample) | 2.2% | 6.5% |
| Standard Deviation (Population) | 2.1% | 6.4% |
Similar Demographics by 11th Grade
Demographics Similar to Macedonians by 11th Grade
In terms of 11th grade, the demographic groups most similar to Macedonians are Filipino (94.1%, a difference of 0.0%), Slavic (94.1%, a difference of 0.0%), French (94.1%, a difference of 0.0%), Serbian (94.1%, a difference of 0.010%), and Australian (94.1%, a difference of 0.020%).
| Demographics | Rating | Rank | 11th Grade |
| Cypriots | 99.9 /100 | #41 | Exceptional 94.1% |
| Immigrants | Austria | 99.9 /100 | #42 | Exceptional 94.1% |
| Greeks | 99.9 /100 | #43 | Exceptional 94.1% |
| Immigrants | Ireland | 99.9 /100 | #44 | Exceptional 94.1% |
| Australians | 99.9 /100 | #45 | Exceptional 94.1% |
| Serbians | 99.9 /100 | #46 | Exceptional 94.1% |
| Filipinos | 99.9 /100 | #47 | Exceptional 94.1% |
| Macedonians | 99.9 /100 | #48 | Exceptional 94.1% |
| Slavs | 99.9 /100 | #49 | Exceptional 94.1% |
| French | 99.9 /100 | #50 | Exceptional 94.1% |
| Turks | 99.9 /100 | #51 | Exceptional 94.0% |
| Immigrants | Canada | 99.9 /100 | #52 | Exceptional 94.0% |
| Immigrants | Australia | 99.9 /100 | #53 | Exceptional 94.0% |
| Immigrants | North America | 99.9 /100 | #54 | Exceptional 94.0% |
| Czechoslovakians | 99.9 /100 | #55 | Exceptional 94.0% |
Demographics Similar to Delaware by 11th Grade
In terms of 11th grade, the demographic groups most similar to Delaware are Mongolian (93.0%, a difference of 0.010%), Immigrants from Italy (92.9%, a difference of 0.020%), Cree (92.9%, a difference of 0.030%), Immigrants from Bosnia and Herzegovina (93.0%, a difference of 0.040%), and Arab (92.9%, a difference of 0.040%).
| Demographics | Rating | Rank | 11th Grade |
| Immigrants | Kazakhstan | 92.4 /100 | #127 | Exceptional 93.1% |
| Immigrants | Jordan | 92.4 /100 | #128 | Exceptional 93.1% |
| Immigrants | Ukraine | 89.8 /100 | #129 | Excellent 93.0% |
| Albanians | 89.5 /100 | #130 | Excellent 93.0% |
| Egyptians | 89.5 /100 | #131 | Excellent 93.0% |
| Immigrants | Bosnia and Herzegovina | 89.0 /100 | #132 | Excellent 93.0% |
| Mongolians | 87.6 /100 | #133 | Excellent 93.0% |
| Delaware | 87.3 /100 | #134 | Excellent 93.0% |
| Immigrants | Italy | 86.6 /100 | #135 | Excellent 92.9% |
| Cree | 85.9 /100 | #136 | Excellent 92.9% |
| Arabs | 85.4 /100 | #137 | Excellent 92.9% |
| Immigrants | Brazil | 85.1 /100 | #138 | Excellent 92.9% |
| Crow | 84.1 /100 | #139 | Excellent 92.9% |
| Venezuelans | 83.4 /100 | #140 | Excellent 92.9% |
| Chileans | 83.0 /100 | #141 | Excellent 92.9% |