Macedonian vs Immigrants from Bosnia and Herzegovina In Labor Force | Age 25-29

COMPARE

Macedonian
Race
Ancestry
AfghanAfricanAlaska NativeAlaskan AthabascanAlbanianAleutAlsatianAmericanApacheArabArapahoArgentineanArmenianAssyrian/Chaldean/SyriacAustralianAustrianBahamianBangladeshiBarbadianBasqueBelgianBelizeanBermudanBhutaneseBlackfeetBolivianBrazilianBritishBritish West IndianBulgarianBurmeseCajunCambodianCanadianCape VerdeanCarpatho RusynCelticCentral AmericanCentral American IndianCherokeeCheyenneChickasawChileanChineseChippewaChoctawColombianColvilleComancheCosta RicanCreeCreekCroatianCrowCubanCypriotCzechCzechoslovakianDanishDelawareDominicanDutchDutch West IndianEastern EuropeanEcuadorianEgyptianEnglishEstonianEthiopianEuropeanFijianFilipinoFinnishFrenchFrench American IndianFrench CanadianGermanGerman RussianGhanaianGreekGuamanian/ChamorroGuatemalanGuyaneseHaitianHmongHonduranHopiHoumaHungarianIcelanderIndian (Asian)IndonesianInupiatIranianIraqiIrishIroquoisIsraeliItalianJamaicanJapaneseJordanianKenyanKiowaKoreanLaotianLatvianLebaneseLiberianLithuanianLumbeeLuxembourgerMacedonianMalaysianMalteseMarshalleseMenomineeMexicanMexican American IndianMongolianMoroccanNative HawaiianNavajoNepaleseNew ZealanderNicaraguanNigerianNorthern EuropeanNorwegianOkinawanOsageOttawaPaiutePakistaniPalestinianPanamanianParaguayanPennsylvania GermanPeruvianPimaPolishPortuguesePotawatomiPuebloPuerto RicanPuget Sound SalishRomanianRussianSalvadoranSamoanScandinavianScotch-IrishScottishSeminoleSenegaleseSerbianShoshoneSierra LeoneanSiouxSlavicSlovakSloveneSomaliSouth AfricanSouth AmericanSouth American IndianSoviet UnionSpaniardSpanishSpanish AmericanSpanish American IndianSri LankanSubsaharan AfricanSudaneseSwedishSwissSyrianTaiwaneseThaiTlingit-HaidaTohono O'OdhamTonganTrinidadian and TobagonianTsimshianTurkishU.S. Virgin IslanderUgandanUkrainianUruguayanUteVenezuelanVietnameseWelshWest IndianYakamaYaquiYugoslavianYumanYup'ikZimbabwean
Immigration
NonimmigrantsImmigrantsAfghanistanAfricaAlbaniaArgentinaArmeniaAsiaAustraliaAustriaBahamasBangladeshBarbadosBelarusBelgiumBelizeBoliviaBrazilBulgariaBurma/MyanmarCabo VerdeCambodiaCameroonCanadaCaribbeanCentral AmericaChileChinaColombiaCongoCosta RicaCroatiaCubaCzechoslovakiaDenmarkDominicaDominican RepublicEastern AfricaEastern AsiaEastern EuropeEcuadorEgyptEl SalvadorEnglandEritreaEthiopiaEuropeFijiFranceGermanyGhanaGreeceGrenadaGuatemalaGuyanaHaitiHondurasHong KongHungaryIndiaIndonesiaIranIraqIrelandIsraelItalyJamaicaJapanJordanKazakhstanKenyaKoreaKuwaitLaosLatin AmericaLatviaLebanonLiberiaLithuaniaMalaysiaMexicoMicronesiaMiddle AfricaMoldovaMoroccoNepalNetherlandsNicaraguaNigeriaNorth AmericaNorth MacedoniaNorthern AfricaNorthern EuropeNorwayOceaniaPakistanPanamaPeruPhilippinesPolandPortugalRomaniaRussiaSaudi ArabiaScotlandSenegalSerbiaSierra LeoneSingaporeSomaliaSouth AfricaSouth AmericaSouth Central AsiaSouth Eastern AsiaSouthern EuropeSpainSri LankaSt. Vincent and the GrenadinesSudanSwedenSwitzerlandSyriaTaiwanThailandTrinidad and TobagoTurkeyUgandaUkraineUruguayUzbekistanVenezuelaVietnamWest IndiesWestern AfricaWestern AsiaWestern EuropeYemenZaireZimbabweAzores
Immigrants from Bosnia and Herzegovina
Race
Ancestry
AfghanAfricanAlaska NativeAlaskan AthabascanAlbanianAleutAlsatianAmericanApacheArabArapahoArgentineanArmenianAssyrian/Chaldean/SyriacAustralianAustrianBahamianBangladeshiBarbadianBasqueBelgianBelizeanBermudanBhutaneseBlackfeetBolivianBrazilianBritishBritish West IndianBulgarianBurmeseCajunCambodianCanadianCape VerdeanCarpatho RusynCelticCentral AmericanCentral American IndianCherokeeCheyenneChickasawChileanChineseChippewaChoctawColombianColvilleComancheCosta RicanCreeCreekCroatianCrowCubanCypriotCzechCzechoslovakianDanishDelawareDominicanDutchDutch West IndianEastern EuropeanEcuadorianEgyptianEnglishEstonianEthiopianEuropeanFijianFilipinoFinnishFrenchFrench American IndianFrench CanadianGermanGerman RussianGhanaianGreekGuamanian/ChamorroGuatemalanGuyaneseHaitianHmongHonduranHopiHoumaHungarianIcelanderIndian (Asian)IndonesianInupiatIranianIraqiIrishIroquoisIsraeliItalianJamaicanJapaneseJordanianKenyanKiowaKoreanLaotianLatvianLebaneseLiberianLithuanianLumbeeLuxembourgerMalaysianMalteseMarshalleseMenomineeMexicanMexican American IndianMongolianMoroccanNative HawaiianNavajoNepaleseNew ZealanderNicaraguanNigerianNorthern EuropeanNorwegianOkinawanOsageOttawaPaiutePakistaniPalestinianPanamanianParaguayanPennsylvania GermanPeruvianPimaPolishPortuguesePotawatomiPuebloPuerto RicanPuget Sound SalishRomanianRussianSalvadoranSamoanScandinavianScotch-IrishScottishSeminoleSenegaleseSerbianShoshoneSierra LeoneanSiouxSlavicSlovakSloveneSomaliSouth AfricanSouth AmericanSouth American IndianSoviet UnionSpaniardSpanishSpanish AmericanSpanish American IndianSri LankanSubsaharan AfricanSudaneseSwedishSwissSyrianTaiwaneseThaiTlingit-HaidaTohono O'OdhamTonganTrinidadian and TobagonianTsimshianTurkishU.S. Virgin IslanderUgandanUkrainianUruguayanUteVenezuelanVietnameseWelshWest IndianYakamaYaquiYugoslavianYumanYup'ikZimbabwean
Immigration
NonimmigrantsImmigrantsAfghanistanAfricaAlbaniaArgentinaArmeniaAsiaAustraliaAustriaBahamasBangladeshBarbadosBelarusBelgiumBelizeBoliviaBosnia and HerzegovinaBrazilBulgariaBurma/MyanmarCabo VerdeCambodiaCameroonCanadaCaribbeanCentral AmericaChileChinaColombiaCongoCosta RicaCroatiaCubaCzechoslovakiaDenmarkDominicaDominican RepublicEastern AfricaEastern AsiaEastern EuropeEcuadorEgyptEl SalvadorEnglandEritreaEthiopiaEuropeFijiFranceGermanyGhanaGreeceGrenadaGuatemalaGuyanaHaitiHondurasHong KongHungaryIndiaIndonesiaIranIraqIrelandIsraelItalyJamaicaJapanJordanKazakhstanKenyaKoreaKuwaitLaosLatin AmericaLatviaLebanonLiberiaLithuaniaMalaysiaMexicoMicronesiaMiddle AfricaMoldovaMoroccoNepalNetherlandsNicaraguaNigeriaNorth AmericaNorth MacedoniaNorthern AfricaNorthern EuropeNorwayOceaniaPakistanPanamaPeruPhilippinesPolandPortugalRomaniaRussiaSaudi ArabiaScotlandSenegalSerbiaSierra LeoneSingaporeSomaliaSouth AfricaSouth AmericaSouth Central AsiaSouth Eastern AsiaSouthern EuropeSpainSri LankaSt. Vincent and the GrenadinesSudanSwedenSwitzerlandSyriaTaiwanThailandTrinidad and TobagoTurkeyUgandaUkraineUruguayUzbekistanVenezuelaVietnamWest IndiesWestern AfricaWestern AsiaWestern EuropeYemenZaireZimbabweAzores
In Labor Force | Age 25-29
Income
Poverty
Unemployment
Labor Participation
Family Structure
Vehicle Availability
Education Level
Disability

In Labor Force | Age 25-29 Comparison

Macedonians

Immigrants from Bosnia and Herzegovina

Exceptional
Exceptional
85.7%
IN LABOR FORCE | AGE 25-29
99.9/ 100
METRIC RATING
44th/ 347
METRIC RANK
86.3%
IN LABOR FORCE | AGE 25-29
100.0/ 100
METRIC RATING
7th/ 347
METRIC RANK

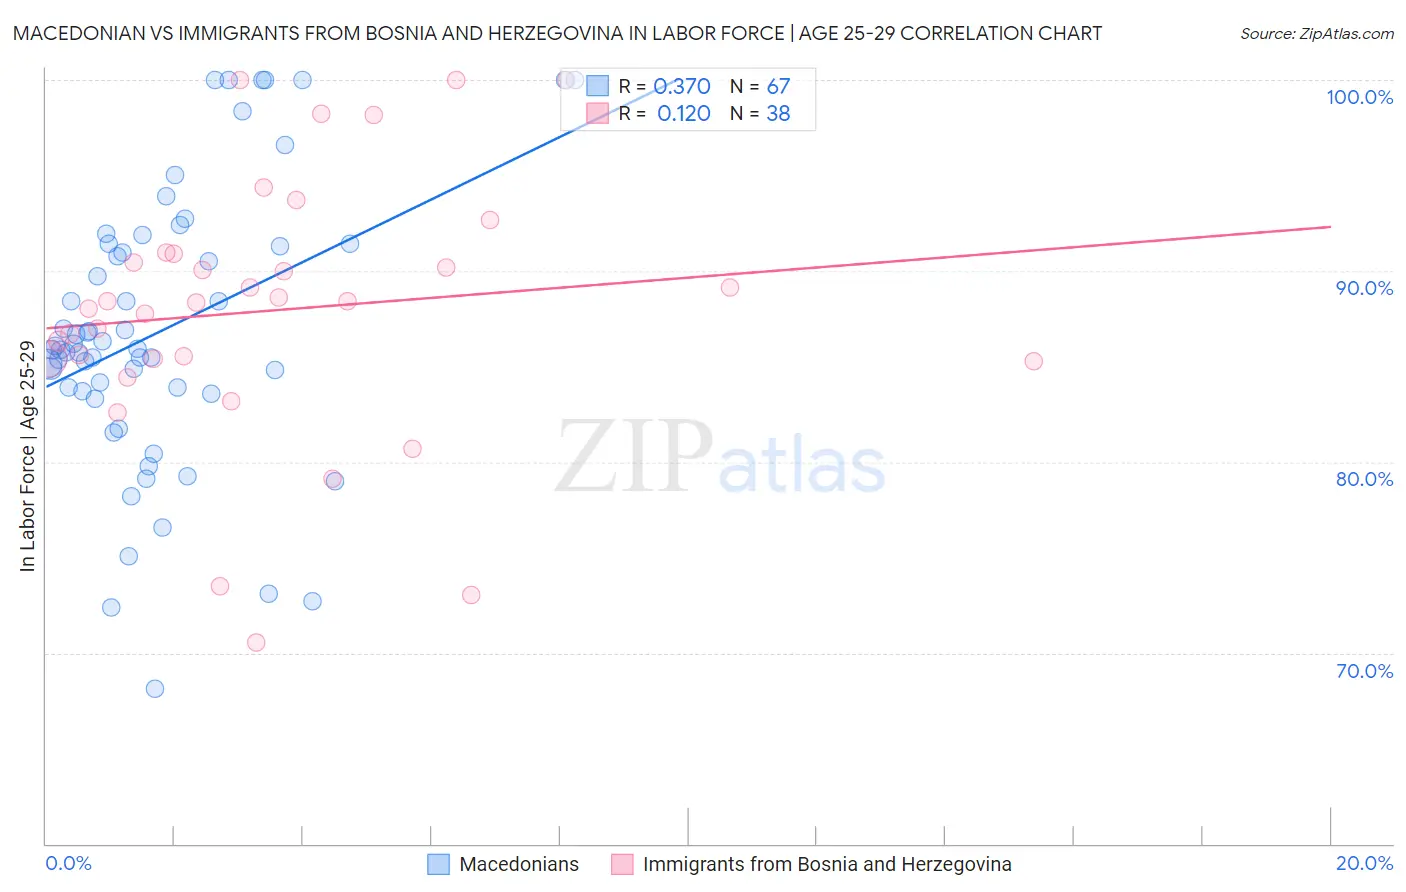
Macedonian vs Immigrants from Bosnia and Herzegovina In Labor Force | Age 25-29 Correlation Chart

The statistical analysis conducted on geographies consisting of 132,648,005 people shows a mild positive correlation between the proportion of Macedonians and labor force participation rate among population between the ages 25 and 29 in the United States with a correlation coefficient (R) of 0.370 and weighted average of 85.7%. Similarly, the statistical analysis conducted on geographies consisting of 156,815,563 people shows a poor positive correlation between the proportion of Immigrants from Bosnia and Herzegovina and labor force participation rate among population between the ages 25 and 29 in the United States with a correlation coefficient (R) of 0.120 and weighted average of 86.3%, a difference of 0.68%.
Macedonian vs Immigrants from Bosnia and Herzegovina In Labor Force | Age 25-29

In Labor Force | Age 25-29 Correlation Summary

MeasurementMacedonianImmigrants from Bosnia and Herzegovina
Minimum68.1%70.6%
Maximum100.0%100.0%
Range31.9%29.4%
Mean86.9%87.9%
Median85.9%88.4%
Interquartile 25% (IQ1)83.7%85.4%
Interquartile 75% (IQ3)91.4%90.9%
Interquartile Range (IQR)7.7%5.5%
Standard Deviation (Sample)7.3%6.9%
Standard Deviation (Population)7.2%6.8%

Similar Demographics by In Labor Force | Age 25-29

Demographics Similar to Macedonians by In Labor Force | Age 25-29

In terms of in labor force | age 25-29, the demographic groups most similar to Macedonians are Immigrants from Sierra Leone (85.7%, a difference of 0.0%), Immigrants from India (85.7%, a difference of 0.010%), Immigrants from Eritrea (85.7%, a difference of 0.020%), Czech (85.6%, a difference of 0.030%), and Immigrants from Greece (85.7%, a difference of 0.060%).
DemographicsRating | RankIn Labor Force | Age 25-29
Poles
99.9
/100
|
#37
Exceptional
85.8%
Sierra Leoneans
99.9
/100
|
#38
Exceptional
85.8%
Croatians
99.9
/100
|
#39
Exceptional
85.8%
Immigrants | Albania
99.9
/100
|
#40
Exceptional
85.7%
Immigrants | Greece
99.9
/100
|
#41
Exceptional
85.7%
Immigrants | Eritrea
99.9
/100
|
#42
Exceptional
85.7%
Immigrants | India
99.9
/100
|
#43
Exceptional
85.7%
Macedonians
99.9
/100
|
#44
Exceptional
85.7%
Immigrants | Sierra Leone
99.9
/100
|
#45
Exceptional
85.7%
Czechs
99.8
/100
|
#46
Exceptional
85.6%
Turks
99.8
/100
|
#47
Exceptional
85.6%
Italians
99.8
/100
|
#48
Exceptional
85.6%
Swedes
99.8
/100
|
#49
Exceptional
85.6%
Yugoslavians
99.8
/100
|
#50
Exceptional
85.6%
Immigrants | Latvia
99.8
/100
|
#51
Exceptional
85.6%

Demographics Similar to Immigrants from Bosnia and Herzegovina by In Labor Force | Age 25-29

In terms of in labor force | age 25-29, the demographic groups most similar to Immigrants from Bosnia and Herzegovina are Immigrants from Cabo Verde (86.2%, a difference of 0.070%), Ethiopian (86.2%, a difference of 0.10%), Slovene (86.4%, a difference of 0.12%), Liberian (86.1%, a difference of 0.15%), and Immigrants from Ethiopia (86.1%, a difference of 0.15%).
DemographicsRating | RankIn Labor Force | Age 25-29
Tsimshian
100.0
/100
|
#1
Exceptional
88.7%
Immigrants | Somalia
100.0
/100
|
#2
Exceptional
87.1%
Somalis
100.0
/100
|
#3
Exceptional
87.1%
Carpatho Rusyns
100.0
/100
|
#4
Exceptional
87.0%
Luxembourgers
100.0
/100
|
#5
Exceptional
86.9%
Slovenes
100.0
/100
|
#6
Exceptional
86.4%
Immigrants | Bosnia and Herzegovina
100.0
/100
|
#7
Exceptional
86.3%
Immigrants | Cabo Verde
100.0
/100
|
#8
Exceptional
86.2%
Ethiopians
100.0
/100
|
#9
Exceptional
86.2%
Liberians
100.0
/100
|
#10
Exceptional
86.1%
Immigrants | Ethiopia
100.0
/100
|
#11
Exceptional
86.1%
Immigrants | Lithuania
100.0
/100
|
#12
Exceptional
86.1%
Norwegians
100.0
/100
|
#13
Exceptional
86.1%
Latvians
100.0
/100
|
#14
Exceptional
86.1%
Bolivians
100.0
/100
|
#15
Exceptional
86.1%