Soviet Union vs Immigrants from Bosnia and Herzegovina Doctorate Degree
COMPARE
Soviet Union
Immigrants from Bosnia and Herzegovina
Doctorate Degree
Doctorate Degree Comparison
Soviet Union
Immigrants from Bosnia and Herzegovina
2.5%
DOCTORATE DEGREE
100.0/ 100
METRIC RATING
43rd/ 347
METRIC RANK
1.7%
DOCTORATE DEGREE
7.8/ 100
METRIC RATING
223rd/ 347
METRIC RANK
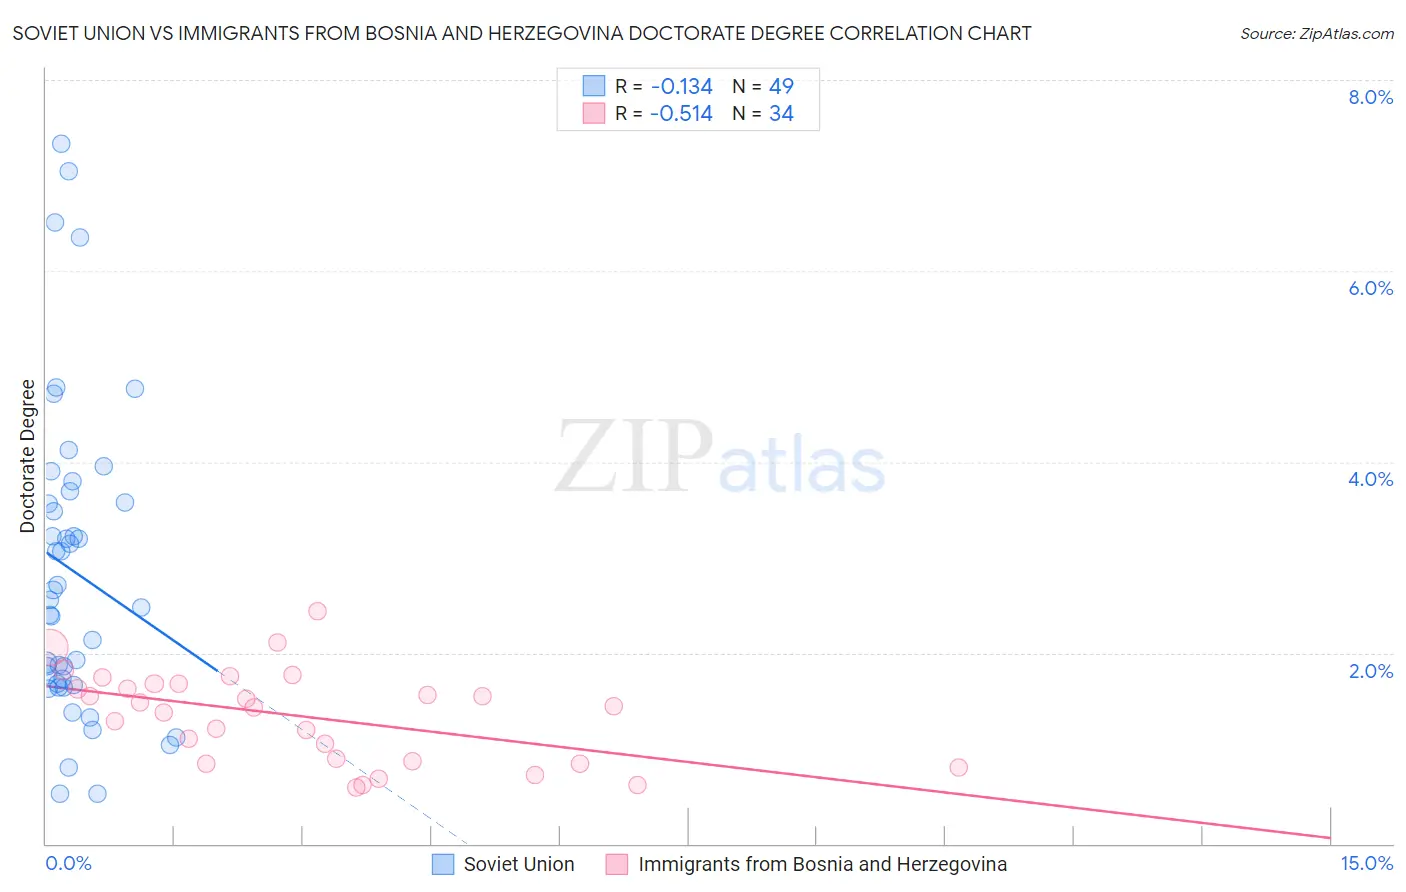
Soviet Union vs Immigrants from Bosnia and Herzegovina Doctorate Degree Correlation Chart
The statistical analysis conducted on geographies consisting of 43,500,474 people shows a poor negative correlation between the proportion of Soviet Union and percentage of population with at least doctorate degree education in the United States with a correlation coefficient (R) of -0.134 and weighted average of 2.5%. Similarly, the statistical analysis conducted on geographies consisting of 156,366,031 people shows a substantial negative correlation between the proportion of Immigrants from Bosnia and Herzegovina and percentage of population with at least doctorate degree education in the United States with a correlation coefficient (R) of -0.514 and weighted average of 1.7%, a difference of 48.3%.
Doctorate Degree Correlation Summary
| Measurement | Soviet Union | Immigrants from Bosnia and Herzegovina |
| Minimum | 0.52% | 0.59% |
| Maximum | 7.3% | 2.4% |
| Range | 6.8% | 1.8% |
| Mean | 2.9% | 1.3% |
| Median | 2.5% | 1.4% |
| Interquartile 25% (IQ1) | 1.7% | 0.86% |
| Interquartile 75% (IQ3) | 3.6% | 1.7% |
| Interquartile Range (IQR) | 2.0% | 0.81% |
| Standard Deviation (Sample) | 1.6% | 0.48% |
| Standard Deviation (Population) | 1.6% | 0.47% |
Similar Demographics by Doctorate Degree
Demographics Similar to Soviet Union by Doctorate Degree
In terms of doctorate degree, the demographic groups most similar to Soviet Union are Immigrants from Netherlands (2.5%, a difference of 0.040%), New Zealander (2.5%, a difference of 0.94%), Immigrants from South Africa (2.4%, a difference of 1.5%), Immigrants from Russia (2.5%, a difference of 1.6%), and Immigrants from Austria (2.4%, a difference of 1.7%).
| Demographics | Rating | Rank | Doctorate Degree |
| Immigrants | Spain | 100.0 /100 | #36 | Exceptional 2.6% |
| Immigrants | Kuwait | 100.0 /100 | #37 | Exceptional 2.6% |
| Russians | 100.0 /100 | #38 | Exceptional 2.6% |
| Immigrants | Ireland | 100.0 /100 | #39 | Exceptional 2.5% |
| Estonians | 100.0 /100 | #40 | Exceptional 2.5% |
| Immigrants | Russia | 100.0 /100 | #41 | Exceptional 2.5% |
| New Zealanders | 100.0 /100 | #42 | Exceptional 2.5% |
| Soviet Union | 100.0 /100 | #43 | Exceptional 2.5% |
| Immigrants | Netherlands | 100.0 /100 | #44 | Exceptional 2.5% |
| Immigrants | South Africa | 100.0 /100 | #45 | Exceptional 2.4% |
| Immigrants | Austria | 100.0 /100 | #46 | Exceptional 2.4% |
| Immigrants | Western Europe | 100.0 /100 | #47 | Exceptional 2.4% |
| Asians | 100.0 /100 | #48 | Exceptional 2.4% |
| Immigrants | Asia | 100.0 /100 | #49 | Exceptional 2.4% |
| Immigrants | Norway | 100.0 /100 | #50 | Exceptional 2.4% |
Demographics Similar to Immigrants from Bosnia and Herzegovina by Doctorate Degree
In terms of doctorate degree, the demographic groups most similar to Immigrants from Bosnia and Herzegovina are Immigrants from Poland (1.7%, a difference of 0.22%), Immigrants from Venezuela (1.7%, a difference of 0.46%), Nonimmigrants (1.7%, a difference of 0.53%), Immigrants from Colombia (1.7%, a difference of 0.71%), and Immigrants from Uruguay (1.7%, a difference of 0.72%).
| Demographics | Rating | Rank | Doctorate Degree |
| Immigrants | Burma/Myanmar | 13.5 /100 | #216 | Poor 1.7% |
| Spanish Americans | 12.9 /100 | #217 | Poor 1.7% |
| Tlingit-Haida | 11.9 /100 | #218 | Poor 1.7% |
| Immigrants | Iraq | 10.7 /100 | #219 | Poor 1.7% |
| Immigrants | Uruguay | 9.2 /100 | #220 | Tragic 1.7% |
| Immigrants | Nonimmigrants | 8.8 /100 | #221 | Tragic 1.7% |
| Immigrants | Venezuela | 8.7 /100 | #222 | Tragic 1.7% |
| Immigrants | Bosnia and Herzegovina | 7.8 /100 | #223 | Tragic 1.7% |
| Immigrants | Poland | 7.4 /100 | #224 | Tragic 1.7% |
| Immigrants | Colombia | 6.7 /100 | #225 | Tragic 1.7% |
| Osage | 6.5 /100 | #226 | Tragic 1.7% |
| Panamanians | 6.3 /100 | #227 | Tragic 1.7% |
| Assyrians/Chaldeans/Syriacs | 5.9 /100 | #228 | Tragic 1.7% |
| Colville | 4.7 /100 | #229 | Tragic 1.6% |
| Immigrants | Philippines | 4.3 /100 | #230 | Tragic 1.6% |