Macedonian vs Nepalese Master's Degree
COMPARE
Macedonian
Nepalese
Master's Degree
Master's Degree Comparison
Macedonians
Nepalese
16.7%
MASTER'S DEGREE
97.7/ 100
METRIC RATING
112th/ 347
METRIC RANK
10.5%
MASTER'S DEGREE
0.0/ 100
METRIC RATING
329th/ 347
METRIC RANK
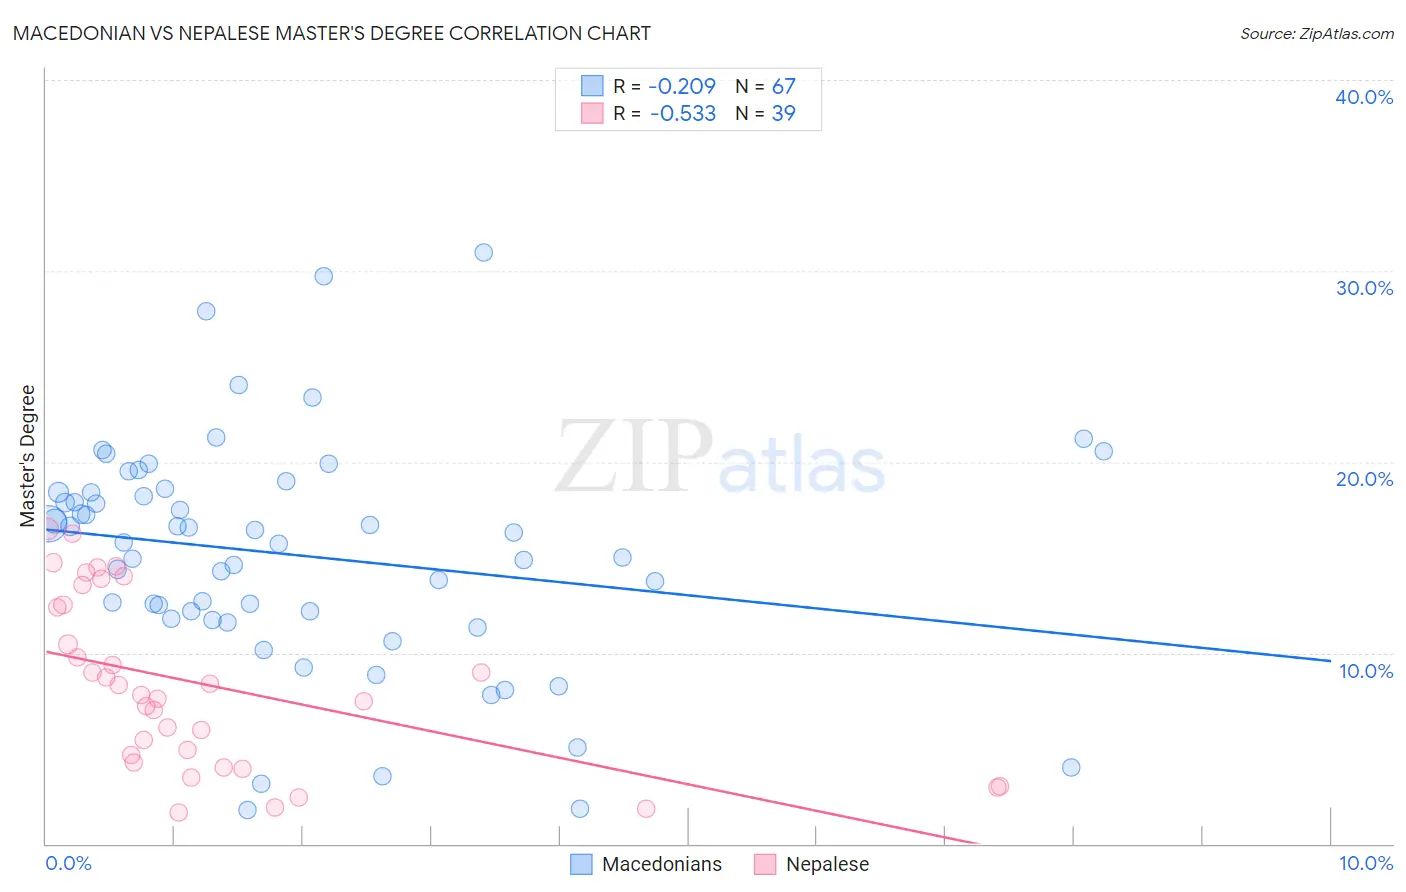
Macedonian vs Nepalese Master's Degree Correlation Chart
The statistical analysis conducted on geographies consisting of 132,580,615 people shows a weak negative correlation between the proportion of Macedonians and percentage of population with at least master's degree education in the United States with a correlation coefficient (R) of -0.209 and weighted average of 16.7%. Similarly, the statistical analysis conducted on geographies consisting of 24,519,269 people shows a substantial negative correlation between the proportion of Nepalese and percentage of population with at least master's degree education in the United States with a correlation coefficient (R) of -0.533 and weighted average of 10.5%, a difference of 59.5%.
Master's Degree Correlation Summary
| Measurement | Macedonian | Nepalese |
| Minimum | 1.8% | 1.7% |
| Maximum | 31.0% | 16.5% |
| Range | 29.2% | 14.8% |
| Mean | 15.1% | 8.3% |
| Median | 15.8% | 7.8% |
| Interquartile 25% (IQ1) | 11.8% | 4.2% |
| Interquartile 75% (IQ3) | 18.4% | 12.5% |
| Interquartile Range (IQR) | 6.6% | 8.3% |
| Standard Deviation (Sample) | 6.0% | 4.5% |
| Standard Deviation (Population) | 5.9% | 4.4% |
Similar Demographics by Master's Degree
Demographics Similar to Macedonians by Master's Degree
In terms of master's degree, the demographic groups most similar to Macedonians are Arab (16.7%, a difference of 0.010%), Northern European (16.7%, a difference of 0.080%), Austrian (16.7%, a difference of 0.14%), Immigrants from Uganda (16.6%, a difference of 0.38%), and Immigrants from Chile (16.8%, a difference of 0.41%).
| Demographics | Rating | Rank | Master's Degree |
| Syrians | 98.3 /100 | #105 | Exceptional 16.8% |
| Immigrants | Albania | 98.1 /100 | #106 | Exceptional 16.8% |
| Armenians | 98.0 /100 | #107 | Exceptional 16.8% |
| Sierra Leoneans | 98.0 /100 | #108 | Exceptional 16.8% |
| Moroccans | 98.0 /100 | #109 | Exceptional 16.8% |
| Immigrants | Chile | 98.0 /100 | #110 | Exceptional 16.8% |
| Austrians | 97.8 /100 | #111 | Exceptional 16.7% |
| Macedonians | 97.7 /100 | #112 | Exceptional 16.7% |
| Arabs | 97.7 /100 | #113 | Exceptional 16.7% |
| Northern Europeans | 97.6 /100 | #114 | Exceptional 16.7% |
| Immigrants | Uganda | 97.3 /100 | #115 | Exceptional 16.6% |
| Immigrants | Southern Europe | 97.2 /100 | #116 | Exceptional 16.6% |
| Immigrants | Moldova | 97.2 /100 | #117 | Exceptional 16.6% |
| Brazilians | 96.8 /100 | #118 | Exceptional 16.5% |
| Jordanians | 96.5 /100 | #119 | Exceptional 16.5% |
Demographics Similar to Nepalese by Master's Degree
In terms of master's degree, the demographic groups most similar to Nepalese are Bangladeshi (10.5%, a difference of 0.080%), Paiute (10.5%, a difference of 0.21%), Inupiat (10.5%, a difference of 0.40%), Creek (10.5%, a difference of 0.40%), and Dutch West Indian (10.6%, a difference of 1.5%).
| Demographics | Rating | Rank | Master's Degree |
| Sioux | 0.0 /100 | #322 | Tragic 10.7% |
| Crow | 0.0 /100 | #323 | Tragic 10.6% |
| Dutch West Indians | 0.0 /100 | #324 | Tragic 10.6% |
| Inupiat | 0.0 /100 | #325 | Tragic 10.5% |
| Creek | 0.0 /100 | #326 | Tragic 10.5% |
| Paiute | 0.0 /100 | #327 | Tragic 10.5% |
| Bangladeshis | 0.0 /100 | #328 | Tragic 10.5% |
| Nepalese | 0.0 /100 | #329 | Tragic 10.5% |
| Fijians | 0.0 /100 | #330 | Tragic 10.3% |
| Pueblo | 0.0 /100 | #331 | Tragic 10.3% |
| Immigrants | Azores | 0.0 /100 | #332 | Tragic 10.2% |
| Menominee | 0.0 /100 | #333 | Tragic 10.2% |
| Arapaho | 0.0 /100 | #334 | Tragic 10.0% |
| Immigrants | Central America | 0.0 /100 | #335 | Tragic 10.0% |
| Natives/Alaskans | 0.0 /100 | #336 | Tragic 9.9% |