Macedonian vs Shoshone Master's Degree
COMPARE
Macedonian
Shoshone
Master's Degree
Master's Degree Comparison
Macedonians
Shoshone
16.7%
MASTER'S DEGREE
97.7/ 100
METRIC RATING
112th/ 347
METRIC RANK
11.1%
MASTER'S DEGREE
0.0/ 100
METRIC RATING
310th/ 347
METRIC RANK
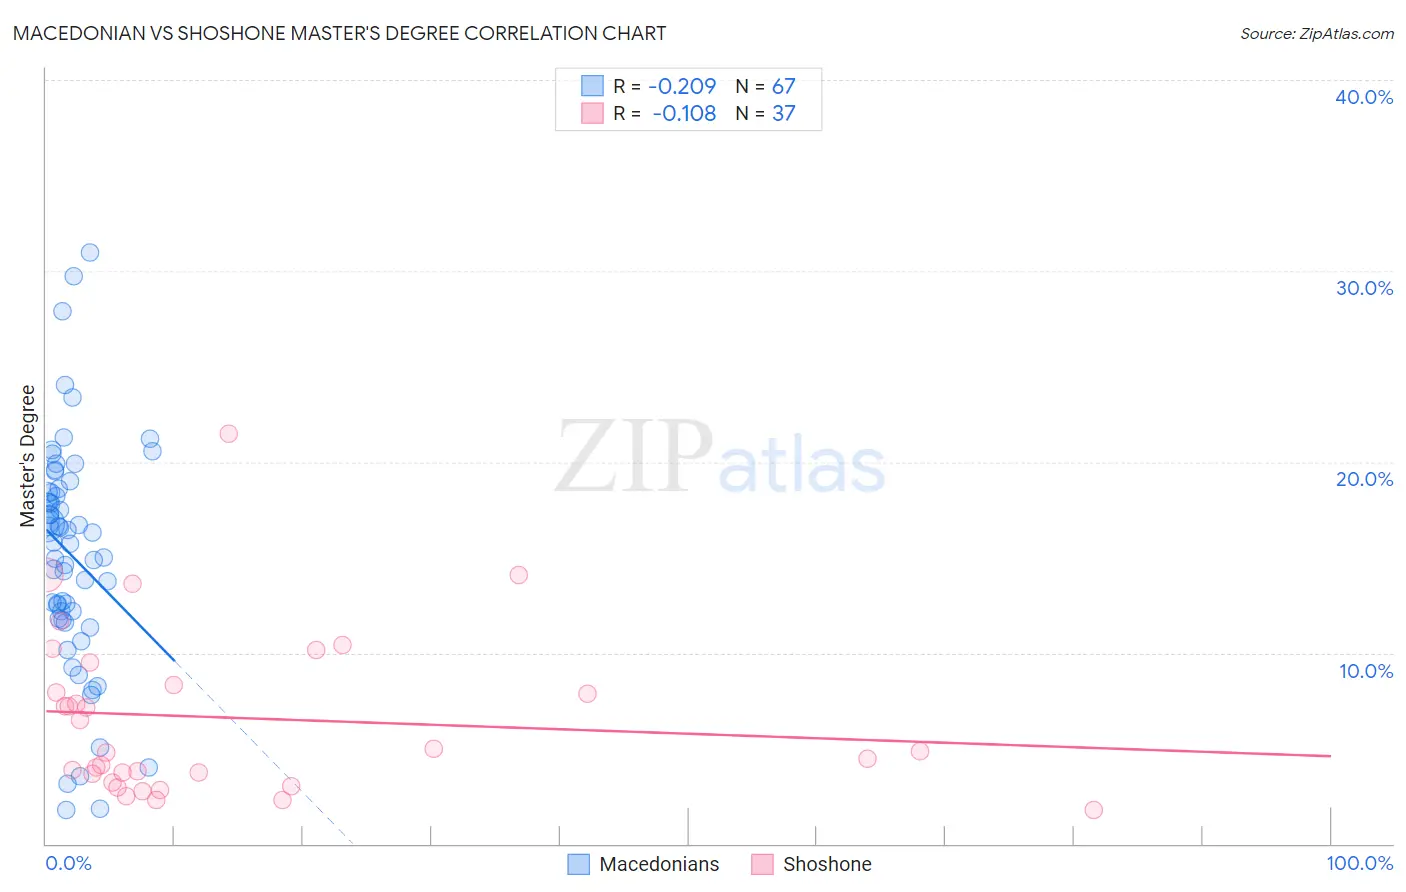
Macedonian vs Shoshone Master's Degree Correlation Chart
The statistical analysis conducted on geographies consisting of 132,580,615 people shows a weak negative correlation between the proportion of Macedonians and percentage of population with at least master's degree education in the United States with a correlation coefficient (R) of -0.209 and weighted average of 16.7%. Similarly, the statistical analysis conducted on geographies consisting of 66,620,223 people shows a poor negative correlation between the proportion of Shoshone and percentage of population with at least master's degree education in the United States with a correlation coefficient (R) of -0.108 and weighted average of 11.1%, a difference of 50.5%.
Master's Degree Correlation Summary
| Measurement | Macedonian | Shoshone |
| Minimum | 1.8% | 1.8% |
| Maximum | 31.0% | 21.5% |
| Range | 29.2% | 19.7% |
| Mean | 15.1% | 6.6% |
| Median | 15.8% | 4.9% |
| Interquartile 25% (IQ1) | 11.8% | 3.4% |
| Interquartile 75% (IQ3) | 18.4% | 8.9% |
| Interquartile Range (IQR) | 6.6% | 5.5% |
| Standard Deviation (Sample) | 6.0% | 4.3% |
| Standard Deviation (Population) | 5.9% | 4.3% |
Similar Demographics by Master's Degree
Demographics Similar to Macedonians by Master's Degree
In terms of master's degree, the demographic groups most similar to Macedonians are Arab (16.7%, a difference of 0.010%), Northern European (16.7%, a difference of 0.080%), Austrian (16.7%, a difference of 0.14%), Immigrants from Uganda (16.6%, a difference of 0.38%), and Immigrants from Chile (16.8%, a difference of 0.41%).
| Demographics | Rating | Rank | Master's Degree |
| Syrians | 98.3 /100 | #105 | Exceptional 16.8% |
| Immigrants | Albania | 98.1 /100 | #106 | Exceptional 16.8% |
| Armenians | 98.0 /100 | #107 | Exceptional 16.8% |
| Sierra Leoneans | 98.0 /100 | #108 | Exceptional 16.8% |
| Moroccans | 98.0 /100 | #109 | Exceptional 16.8% |
| Immigrants | Chile | 98.0 /100 | #110 | Exceptional 16.8% |
| Austrians | 97.8 /100 | #111 | Exceptional 16.7% |
| Macedonians | 97.7 /100 | #112 | Exceptional 16.7% |
| Arabs | 97.7 /100 | #113 | Exceptional 16.7% |
| Northern Europeans | 97.6 /100 | #114 | Exceptional 16.7% |
| Immigrants | Uganda | 97.3 /100 | #115 | Exceptional 16.6% |
| Immigrants | Southern Europe | 97.2 /100 | #116 | Exceptional 16.6% |
| Immigrants | Moldova | 97.2 /100 | #117 | Exceptional 16.6% |
| Brazilians | 96.8 /100 | #118 | Exceptional 16.5% |
| Jordanians | 96.5 /100 | #119 | Exceptional 16.5% |
Demographics Similar to Shoshone by Master's Degree
In terms of master's degree, the demographic groups most similar to Shoshone are Puget Sound Salish (11.1%, a difference of 0.36%), Seminole (11.0%, a difference of 0.51%), Choctaw (11.0%, a difference of 0.61%), Puerto Rican (11.2%, a difference of 0.65%), and Yaqui (11.0%, a difference of 0.79%).
| Demographics | Rating | Rank | Master's Degree |
| Immigrants | Laos | 0.1 /100 | #303 | Tragic 11.4% |
| Immigrants | Cabo Verde | 0.1 /100 | #304 | Tragic 11.3% |
| Immigrants | Latin America | 0.0 /100 | #305 | Tragic 11.3% |
| Mexican American Indians | 0.0 /100 | #306 | Tragic 11.2% |
| Cheyenne | 0.0 /100 | #307 | Tragic 11.2% |
| Puerto Ricans | 0.0 /100 | #308 | Tragic 11.2% |
| Puget Sound Salish | 0.0 /100 | #309 | Tragic 11.1% |
| Shoshone | 0.0 /100 | #310 | Tragic 11.1% |
| Seminole | 0.0 /100 | #311 | Tragic 11.0% |
| Choctaw | 0.0 /100 | #312 | Tragic 11.0% |
| Yaqui | 0.0 /100 | #313 | Tragic 11.0% |
| Cajuns | 0.0 /100 | #314 | Tragic 11.0% |
| Apache | 0.0 /100 | #315 | Tragic 11.0% |
| Hispanics or Latinos | 0.0 /100 | #316 | Tragic 10.9% |
| Hopi | 0.0 /100 | #317 | Tragic 10.9% |