Bolivian vs Immigrants from Australia 8th Grade
COMPARE
Bolivian
Immigrants from Australia
8th Grade
8th Grade Comparison
Bolivians
Immigrants from Australia
95.0%
8TH GRADE
1.0/ 100
METRIC RATING
251st/ 347
METRIC RANK
96.5%
8TH GRADE
99.0/ 100
METRIC RATING
87th/ 347
METRIC RANK
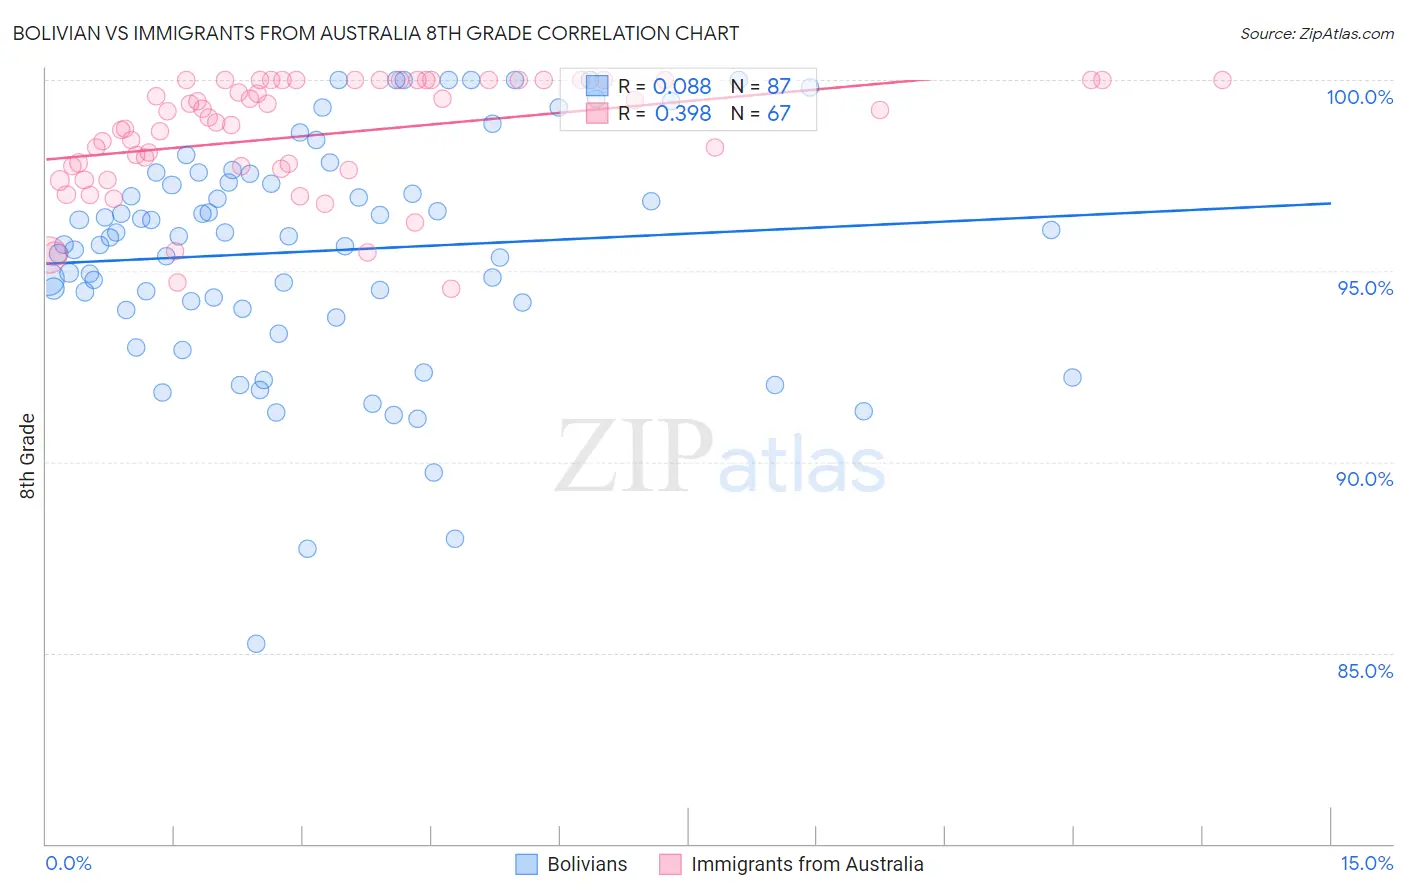
Bolivian vs Immigrants from Australia 8th Grade Correlation Chart
The statistical analysis conducted on geographies consisting of 184,666,822 people shows a slight positive correlation between the proportion of Bolivians and percentage of population with at least 8th grade education in the United States with a correlation coefficient (R) of 0.088 and weighted average of 95.0%. Similarly, the statistical analysis conducted on geographies consisting of 227,203,192 people shows a mild positive correlation between the proportion of Immigrants from Australia and percentage of population with at least 8th grade education in the United States with a correlation coefficient (R) of 0.398 and weighted average of 96.5%, a difference of 1.5%.
8th Grade Correlation Summary
| Measurement | Bolivian | Immigrants from Australia |
| Minimum | 85.2% | 94.5% |
| Maximum | 100.0% | 100.0% |
| Range | 14.8% | 5.5% |
| Mean | 95.5% | 98.6% |
| Median | 95.9% | 99.0% |
| Interquartile 25% (IQ1) | 94.0% | 97.7% |
| Interquartile 75% (IQ3) | 97.5% | 100.0% |
| Interquartile Range (IQR) | 3.5% | 2.3% |
| Standard Deviation (Sample) | 3.0% | 1.5% |
| Standard Deviation (Population) | 3.0% | 1.5% |
Similar Demographics by 8th Grade
Demographics Similar to Bolivians by 8th Grade
In terms of 8th grade, the demographic groups most similar to Bolivians are Immigrants from Ethiopia (95.0%, a difference of 0.0%), Immigrants from China (95.0%, a difference of 0.010%), Korean (95.0%, a difference of 0.010%), U.S. Virgin Islander (95.0%, a difference of 0.010%), and Uruguayan (95.1%, a difference of 0.030%).
| Demographics | Rating | Rank | 8th Grade |
| Immigrants | Middle Africa | 1.7 /100 | #244 | Tragic 95.1% |
| Jamaicans | 1.4 /100 | #245 | Tragic 95.1% |
| Somalis | 1.4 /100 | #246 | Tragic 95.1% |
| Immigrants | Senegal | 1.4 /100 | #247 | Tragic 95.1% |
| Uruguayans | 1.2 /100 | #248 | Tragic 95.1% |
| Immigrants | China | 1.1 /100 | #249 | Tragic 95.0% |
| Koreans | 1.1 /100 | #250 | Tragic 95.0% |
| Bolivians | 1.0 /100 | #251 | Tragic 95.0% |
| Immigrants | Ethiopia | 1.0 /100 | #252 | Tragic 95.0% |
| U.S. Virgin Islanders | 0.9 /100 | #253 | Tragic 95.0% |
| Immigrants | Cameroon | 0.8 /100 | #254 | Tragic 95.0% |
| Immigrants | Somalia | 0.7 /100 | #255 | Tragic 95.0% |
| Colombians | 0.7 /100 | #256 | Tragic 95.0% |
| Afghans | 0.6 /100 | #257 | Tragic 94.9% |
| Immigrants | Congo | 0.6 /100 | #258 | Tragic 94.9% |
Demographics Similar to Immigrants from Australia by 8th Grade
In terms of 8th grade, the demographic groups most similar to Immigrants from Australia are Immigrants from South Africa (96.5%, a difference of 0.0%), Cherokee (96.5%, a difference of 0.0%), Immigrants from Western Europe (96.4%, a difference of 0.010%), Immigrants from Belgium (96.5%, a difference of 0.020%), and Chickasaw (96.4%, a difference of 0.020%).
| Demographics | Rating | Rank | 8th Grade |
| Delaware | 99.2 /100 | #80 | Exceptional 96.5% |
| Romanians | 99.2 /100 | #81 | Exceptional 96.5% |
| Turks | 99.2 /100 | #82 | Exceptional 96.5% |
| Icelanders | 99.2 /100 | #83 | Exceptional 96.5% |
| Immigrants | Belgium | 99.1 /100 | #84 | Exceptional 96.5% |
| Immigrants | South Africa | 99.1 /100 | #85 | Exceptional 96.5% |
| Cherokee | 99.0 /100 | #86 | Exceptional 96.5% |
| Immigrants | Australia | 99.0 /100 | #87 | Exceptional 96.5% |
| Immigrants | Western Europe | 99.0 /100 | #88 | Exceptional 96.4% |
| Chickasaw | 98.9 /100 | #89 | Exceptional 96.4% |
| Immigrants | Sweden | 98.9 /100 | #90 | Exceptional 96.4% |
| Thais | 98.9 /100 | #91 | Exceptional 96.4% |
| Menominee | 98.9 /100 | #92 | Exceptional 96.4% |
| Immigrants | Denmark | 98.8 /100 | #93 | Exceptional 96.4% |
| Immigrants | Singapore | 98.8 /100 | #94 | Exceptional 96.4% |