Sioux vs Thai College, Under 1 year
COMPARE
Sioux
Thai
College, Under 1 year
College, Under 1 year Comparison
Sioux
Thais
59.4%
COLLEGE, UNDER 1 YEAR
0.0/ 100
METRIC RATING
287th/ 347
METRIC RANK
73.4%
COLLEGE, UNDER 1 YEAR
100.0/ 100
METRIC RATING
8th/ 347
METRIC RANK
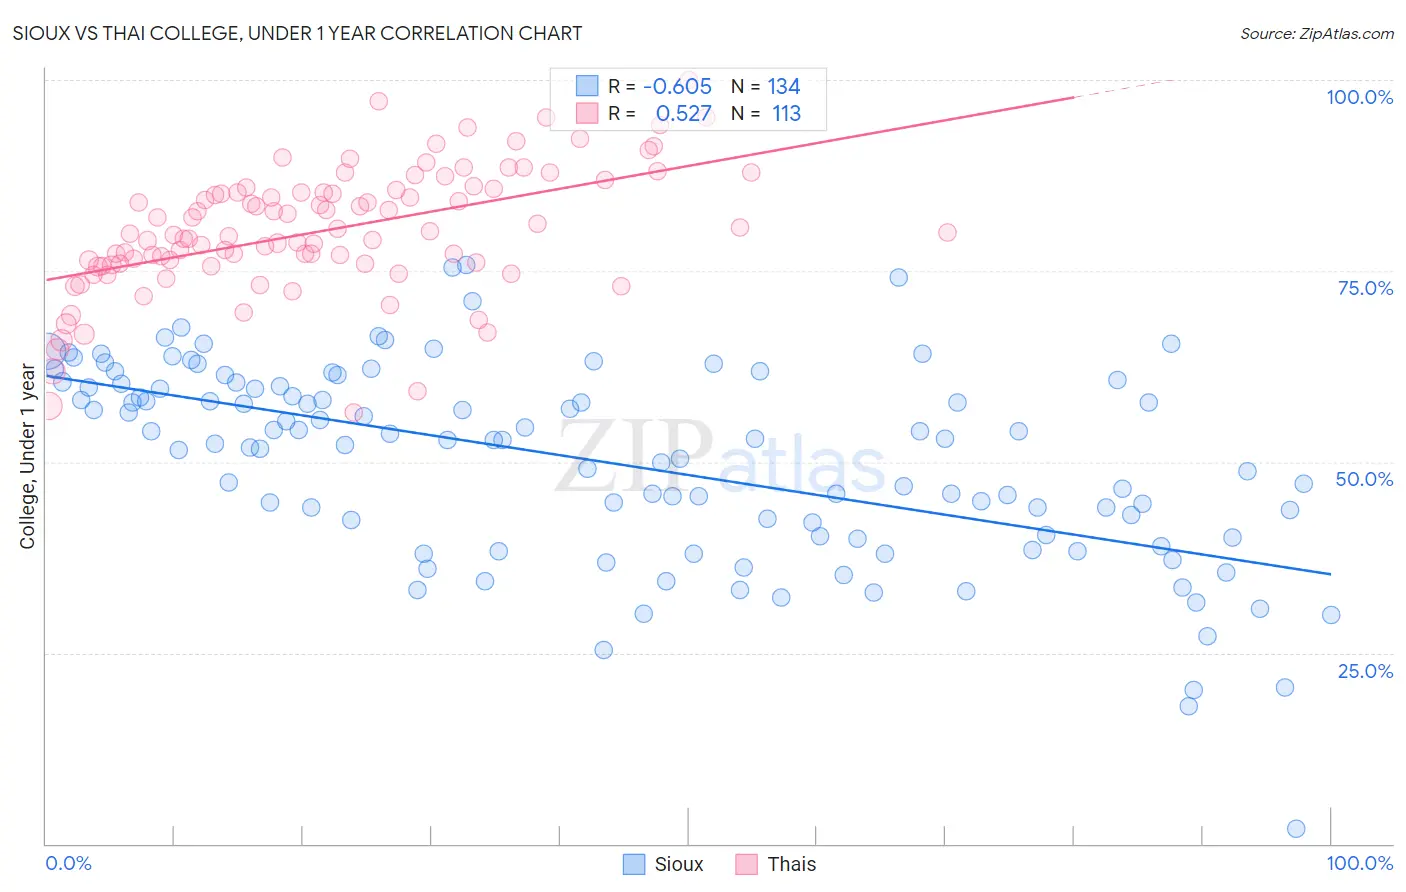
Sioux vs Thai College, Under 1 year Correlation Chart
The statistical analysis conducted on geographies consisting of 234,200,116 people shows a significant negative correlation between the proportion of Sioux and percentage of population with at least college, under 1 year education in the United States with a correlation coefficient (R) of -0.605 and weighted average of 59.4%. Similarly, the statistical analysis conducted on geographies consisting of 475,810,175 people shows a substantial positive correlation between the proportion of Thais and percentage of population with at least college, under 1 year education in the United States with a correlation coefficient (R) of 0.527 and weighted average of 73.4%, a difference of 23.5%.
College, Under 1 year Correlation Summary
| Measurement | Sioux | Thai |
| Minimum | 2.0% | 56.5% |
| Maximum | 75.8% | 100.0% |
| Range | 73.8% | 43.5% |
| Mean | 50.0% | 80.3% |
| Median | 52.8% | 79.9% |
| Interquartile 25% (IQ1) | 40.2% | 75.8% |
| Interquartile 75% (IQ3) | 59.9% | 85.5% |
| Interquartile Range (IQR) | 19.7% | 9.6% |
| Standard Deviation (Sample) | 12.9% | 8.2% |
| Standard Deviation (Population) | 12.9% | 8.2% |
Similar Demographics by College, Under 1 year
Demographics Similar to Sioux by College, Under 1 year
In terms of college, under 1 year, the demographic groups most similar to Sioux are Black/African American (59.4%, a difference of 0.10%), British West Indian (59.5%, a difference of 0.17%), Choctaw (59.3%, a difference of 0.17%), Ecuadorian (59.3%, a difference of 0.21%), and Creek (59.3%, a difference of 0.29%).
| Demographics | Rating | Rank | College, Under 1 year |
| Crow | 0.1 /100 | #280 | Tragic 60.2% |
| Cherokee | 0.1 /100 | #281 | Tragic 60.1% |
| Belizeans | 0.1 /100 | #282 | Tragic 60.1% |
| Immigrants | Jamaica | 0.0 /100 | #283 | Tragic 59.7% |
| Immigrants | St. Vincent and the Grenadines | 0.0 /100 | #284 | Tragic 59.6% |
| Paiute | 0.0 /100 | #285 | Tragic 59.6% |
| British West Indians | 0.0 /100 | #286 | Tragic 59.5% |
| Sioux | 0.0 /100 | #287 | Tragic 59.4% |
| Blacks/African Americans | 0.0 /100 | #288 | Tragic 59.4% |
| Choctaw | 0.0 /100 | #289 | Tragic 59.3% |
| Ecuadorians | 0.0 /100 | #290 | Tragic 59.3% |
| Creek | 0.0 /100 | #291 | Tragic 59.3% |
| Nicaraguans | 0.0 /100 | #292 | Tragic 59.2% |
| Seminole | 0.0 /100 | #293 | Tragic 59.1% |
| Immigrants | Belize | 0.0 /100 | #294 | Tragic 59.1% |
Demographics Similar to Thais by College, Under 1 year
In terms of college, under 1 year, the demographic groups most similar to Thais are Okinawan (73.7%, a difference of 0.33%), Immigrants from Australia (72.7%, a difference of 0.95%), Immigrants from Taiwan (74.2%, a difference of 1.0%), Immigrants from Iran (74.3%, a difference of 1.1%), and Immigrants from India (74.4%, a difference of 1.4%).
| Demographics | Rating | Rank | College, Under 1 year |
| Filipinos | 100.0 /100 | #1 | Exceptional 75.5% |
| Iranians | 100.0 /100 | #2 | Exceptional 74.9% |
| Immigrants | Singapore | 100.0 /100 | #3 | Exceptional 74.8% |
| Immigrants | India | 100.0 /100 | #4 | Exceptional 74.4% |
| Immigrants | Iran | 100.0 /100 | #5 | Exceptional 74.3% |
| Immigrants | Taiwan | 100.0 /100 | #6 | Exceptional 74.2% |
| Okinawans | 100.0 /100 | #7 | Exceptional 73.7% |
| Thais | 100.0 /100 | #8 | Exceptional 73.4% |
| Immigrants | Australia | 100.0 /100 | #9 | Exceptional 72.7% |
| Immigrants | Israel | 100.0 /100 | #10 | Exceptional 72.3% |
| Immigrants | South Central Asia | 100.0 /100 | #11 | Exceptional 72.1% |
| Immigrants | Sweden | 100.0 /100 | #12 | Exceptional 72.1% |
| Cypriots | 100.0 /100 | #13 | Exceptional 72.0% |
| Cambodians | 100.0 /100 | #14 | Exceptional 71.9% |
| Burmese | 100.0 /100 | #15 | Exceptional 71.9% |