Immigrants from Ecuador vs Spaniard No Schooling Completed
COMPARE
Immigrants from Ecuador
Spaniard
No Schooling Completed
No Schooling Completed Comparison
Immigrants from Ecuador
Spaniards
3.1%
NO SCHOOLING COMPLETED
0.0/ 100
METRIC RATING
316th/ 347
METRIC RANK
1.9%
NO SCHOOLING COMPLETED
92.3/ 100
METRIC RATING
128th/ 347
METRIC RANK
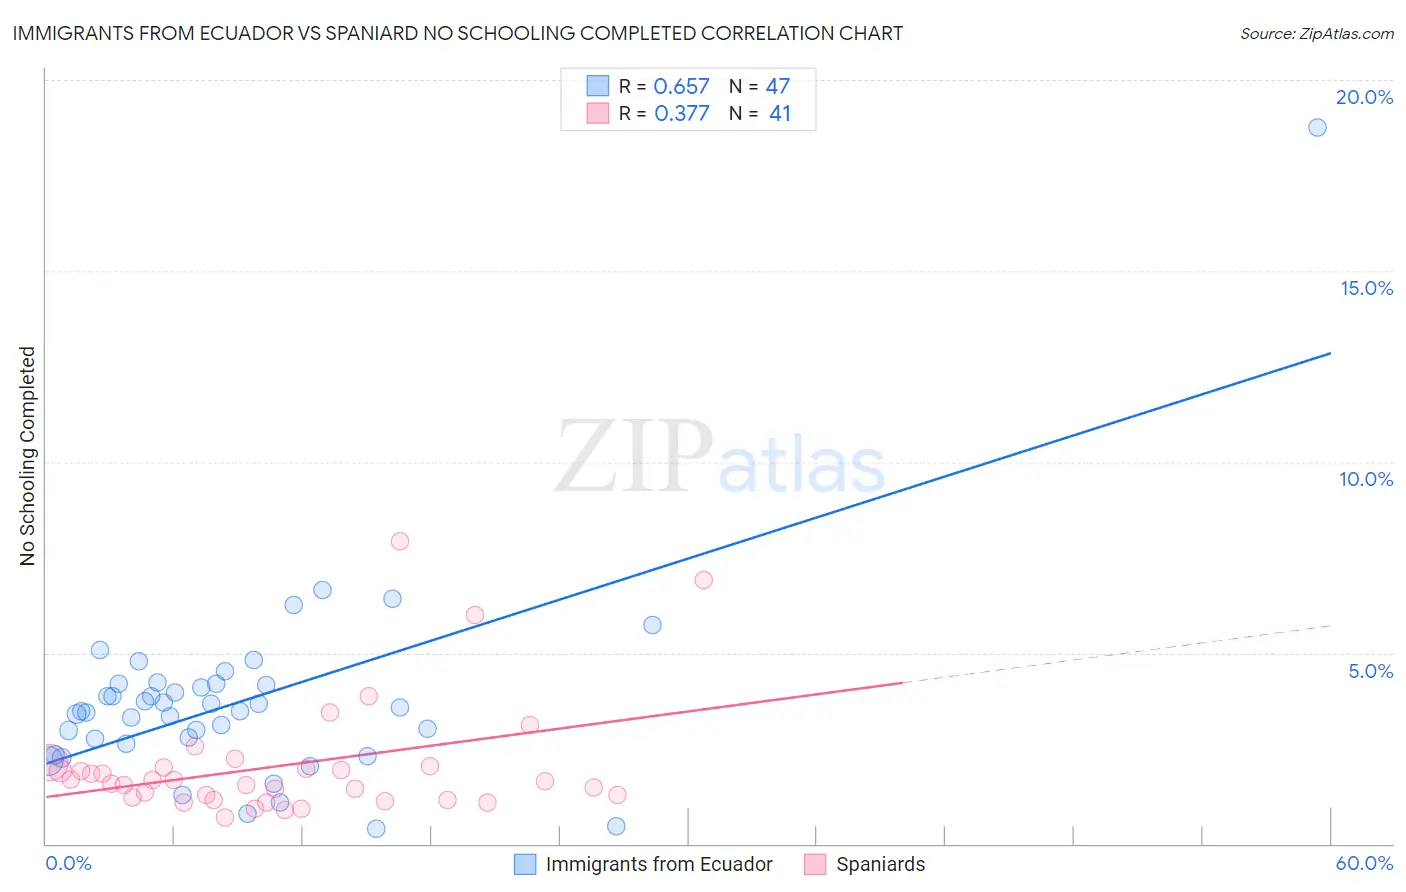
Immigrants from Ecuador vs Spaniard No Schooling Completed Correlation Chart
The statistical analysis conducted on geographies consisting of 269,548,535 people shows a significant positive correlation between the proportion of Immigrants from Ecuador and percentage of population with no schooling in the United States with a correlation coefficient (R) of 0.657 and weighted average of 3.1%. Similarly, the statistical analysis conducted on geographies consisting of 437,809,965 people shows a mild positive correlation between the proportion of Spaniards and percentage of population with no schooling in the United States with a correlation coefficient (R) of 0.377 and weighted average of 1.9%, a difference of 60.9%.
No Schooling Completed Correlation Summary
| Measurement | Immigrants from Ecuador | Spaniard |
| Minimum | 0.40% | 0.69% |
| Maximum | 18.8% | 7.9% |
| Range | 18.3% | 7.2% |
| Mean | 3.7% | 2.1% |
| Median | 3.5% | 1.7% |
| Interquartile 25% (IQ1) | 2.6% | 1.2% |
| Interquartile 75% (IQ3) | 4.2% | 2.0% |
| Interquartile Range (IQR) | 1.5% | 0.84% |
| Standard Deviation (Sample) | 2.6% | 1.6% |
| Standard Deviation (Population) | 2.6% | 1.5% |
Similar Demographics by No Schooling Completed
Demographics Similar to Immigrants from Ecuador by No Schooling Completed
In terms of no schooling completed, the demographic groups most similar to Immigrants from Ecuador are Immigrants from Nicaragua (3.1%, a difference of 0.36%), Cape Verdean (3.1%, a difference of 0.49%), Immigrants from Belize (3.1%, a difference of 0.60%), Honduran (3.1%, a difference of 0.69%), and Immigrants from Guyana (3.1%, a difference of 1.2%).
| Demographics | Rating | Rank | No Schooling Completed |
| Hispanics or Latinos | 0.0 /100 | #309 | Tragic 3.0% |
| Guyanese | 0.0 /100 | #310 | Tragic 3.0% |
| Immigrants | Azores | 0.0 /100 | #311 | Tragic 3.0% |
| Sri Lankans | 0.0 /100 | #312 | Tragic 3.0% |
| Hondurans | 0.0 /100 | #313 | Tragic 3.1% |
| Immigrants | Belize | 0.0 /100 | #314 | Tragic 3.1% |
| Immigrants | Nicaragua | 0.0 /100 | #315 | Tragic 3.1% |
| Immigrants | Ecuador | 0.0 /100 | #316 | Tragic 3.1% |
| Cape Verdeans | 0.0 /100 | #317 | Tragic 3.1% |
| Immigrants | Guyana | 0.0 /100 | #318 | Tragic 3.1% |
| Immigrants | Burma/Myanmar | 0.0 /100 | #319 | Tragic 3.1% |
| Immigrants | Bangladesh | 0.0 /100 | #320 | Tragic 3.1% |
| Immigrants | Laos | 0.0 /100 | #321 | Tragic 3.1% |
| Immigrants | Honduras | 0.0 /100 | #322 | Tragic 3.2% |
| Vietnamese | 0.0 /100 | #323 | Tragic 3.2% |
Demographics Similar to Spaniards by No Schooling Completed
In terms of no schooling completed, the demographic groups most similar to Spaniards are Israeli (1.9%, a difference of 0.090%), Seminole (1.9%, a difference of 0.14%), Immigrants from Romania (1.9%, a difference of 0.15%), Palestinian (1.9%, a difference of 0.25%), and Immigrants from Hungary (1.9%, a difference of 0.35%).
| Demographics | Rating | Rank | No Schooling Completed |
| Immigrants | Croatia | 94.5 /100 | #121 | Exceptional 1.9% |
| Cree | 94.5 /100 | #122 | Exceptional 1.9% |
| Immigrants | Kuwait | 93.9 /100 | #123 | Exceptional 1.9% |
| Cambodians | 93.8 /100 | #124 | Exceptional 1.9% |
| Immigrants | Europe | 93.7 /100 | #125 | Exceptional 1.9% |
| Immigrants | Romania | 92.6 /100 | #126 | Exceptional 1.9% |
| Israelis | 92.4 /100 | #127 | Exceptional 1.9% |
| Spaniards | 92.3 /100 | #128 | Exceptional 1.9% |
| Seminole | 92.0 /100 | #129 | Exceptional 1.9% |
| Palestinians | 91.8 /100 | #130 | Exceptional 1.9% |
| Immigrants | Hungary | 91.6 /100 | #131 | Exceptional 1.9% |
| Colville | 90.4 /100 | #132 | Exceptional 1.9% |
| Immigrants | Turkey | 90.2 /100 | #133 | Exceptional 1.9% |
| Menominee | 89.6 /100 | #134 | Excellent 1.9% |
| Hmong | 88.5 /100 | #135 | Excellent 1.9% |