Immigrants from Venezuela vs Jordanian No Schooling Completed
COMPARE
Immigrants from Venezuela
Jordanian
No Schooling Completed
No Schooling Completed Comparison
Immigrants from Venezuela
Jordanians
2.0%
NO SCHOOLING COMPLETED
68.5/ 100
METRIC RATING
154th/ 347
METRIC RANK
2.0%
NO SCHOOLING COMPLETED
84.5/ 100
METRIC RATING
139th/ 347
METRIC RANK
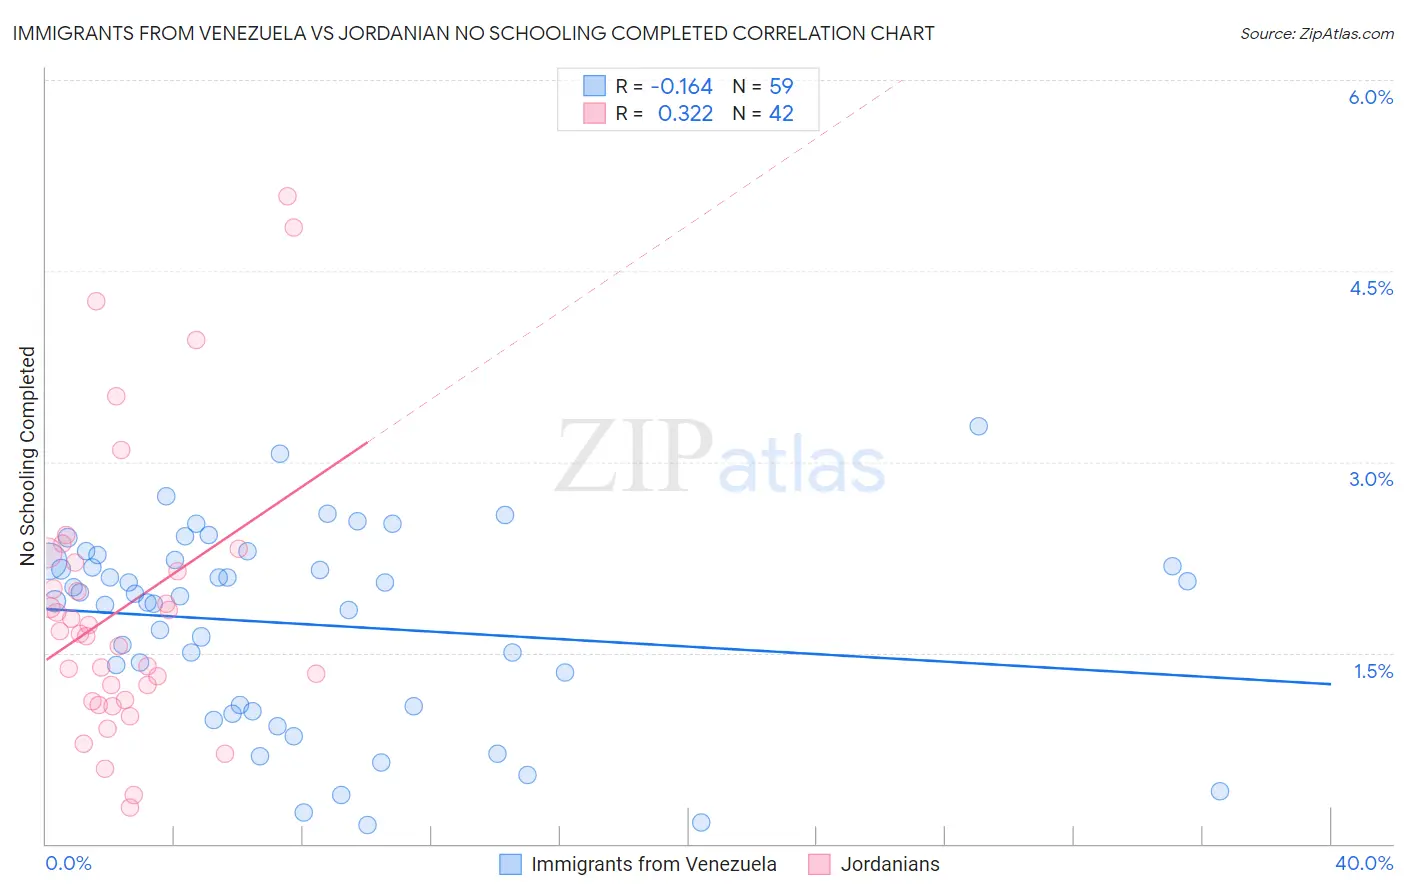
Immigrants from Venezuela vs Jordanian No Schooling Completed Correlation Chart
The statistical analysis conducted on geographies consisting of 286,388,596 people shows a poor negative correlation between the proportion of Immigrants from Venezuela and percentage of population with no schooling in the United States with a correlation coefficient (R) of -0.164 and weighted average of 2.0%. Similarly, the statistical analysis conducted on geographies consisting of 166,048,853 people shows a mild positive correlation between the proportion of Jordanians and percentage of population with no schooling in the United States with a correlation coefficient (R) of 0.322 and weighted average of 2.0%, a difference of 3.3%.
No Schooling Completed Correlation Summary
| Measurement | Immigrants from Venezuela | Jordanian |
| Minimum | 0.14% | 0.29% |
| Maximum | 3.3% | 5.1% |
| Range | 3.1% | 4.8% |
| Mean | 1.7% | 1.9% |
| Median | 1.9% | 1.7% |
| Interquartile 25% (IQ1) | 1.1% | 1.1% |
| Interquartile 75% (IQ3) | 2.2% | 2.2% |
| Interquartile Range (IQR) | 1.2% | 1.1% |
| Standard Deviation (Sample) | 0.75% | 1.1% |
| Standard Deviation (Population) | 0.75% | 1.1% |
Demographics Similar to Immigrants from Venezuela and Jordanians by No Schooling Completed
In terms of no schooling completed, the demographic groups most similar to Immigrants from Venezuela are Immigrants from Italy (2.0%, a difference of 0.060%), Immigrants from Russia (2.0%, a difference of 0.14%), Chilean (2.0%, a difference of 0.21%), Immigrants from Eastern Europe (2.0%, a difference of 0.30%), and Immigrants from Jordan (2.0%, a difference of 0.39%). Similarly, the demographic groups most similar to Jordanians are Immigrants from Israel (2.0%, a difference of 0.25%), Marshallese (2.0%, a difference of 0.26%), Immigrants from Greece (2.0%, a difference of 0.27%), Filipino (2.0%, a difference of 0.29%), and Venezuelan (2.0%, a difference of 0.76%).
| Demographics | Rating | Rank | No Schooling Completed |
| Burmese | 88.2 /100 | #136 | Excellent 1.9% |
| Filipinos | 85.5 /100 | #137 | Excellent 2.0% |
| Immigrants | Israel | 85.4 /100 | #138 | Excellent 2.0% |
| Jordanians | 84.5 /100 | #139 | Excellent 2.0% |
| Marshallese | 83.5 /100 | #140 | Excellent 2.0% |
| Immigrants | Greece | 83.5 /100 | #141 | Excellent 2.0% |
| Venezuelans | 81.5 /100 | #142 | Excellent 2.0% |
| Immigrants | South Central Asia | 80.0 /100 | #143 | Good 2.0% |
| Alsatians | 79.1 /100 | #144 | Good 2.0% |
| Immigrants | Iran | 79.0 /100 | #145 | Good 2.0% |
| Immigrants | Moldova | 78.0 /100 | #146 | Good 2.0% |
| Soviet Union | 77.1 /100 | #147 | Good 2.0% |
| Shoshone | 76.7 /100 | #148 | Good 2.0% |
| Immigrants | North Macedonia | 75.9 /100 | #149 | Good 2.0% |
| Blackfeet | 72.9 /100 | #150 | Good 2.0% |
| Immigrants | Jordan | 70.9 /100 | #151 | Good 2.0% |
| Immigrants | Eastern Europe | 70.4 /100 | #152 | Good 2.0% |
| Immigrants | Italy | 68.9 /100 | #153 | Good 2.0% |
| Immigrants | Venezuela | 68.5 /100 | #154 | Good 2.0% |
| Immigrants | Russia | 67.6 /100 | #155 | Good 2.0% |
| Chileans | 67.2 /100 | #156 | Good 2.0% |