Lumbee vs Spanish American Master's Degree
COMPARE
Lumbee
Spanish American
Master's Degree
Master's Degree Comparison
Lumbee
Spanish Americans
9.3%
MASTER'S DEGREE
0.0/ 100
METRIC RATING
343rd/ 347
METRIC RANK
13.0%
MASTER'S DEGREE
1.9/ 100
METRIC RATING
242nd/ 347
METRIC RANK
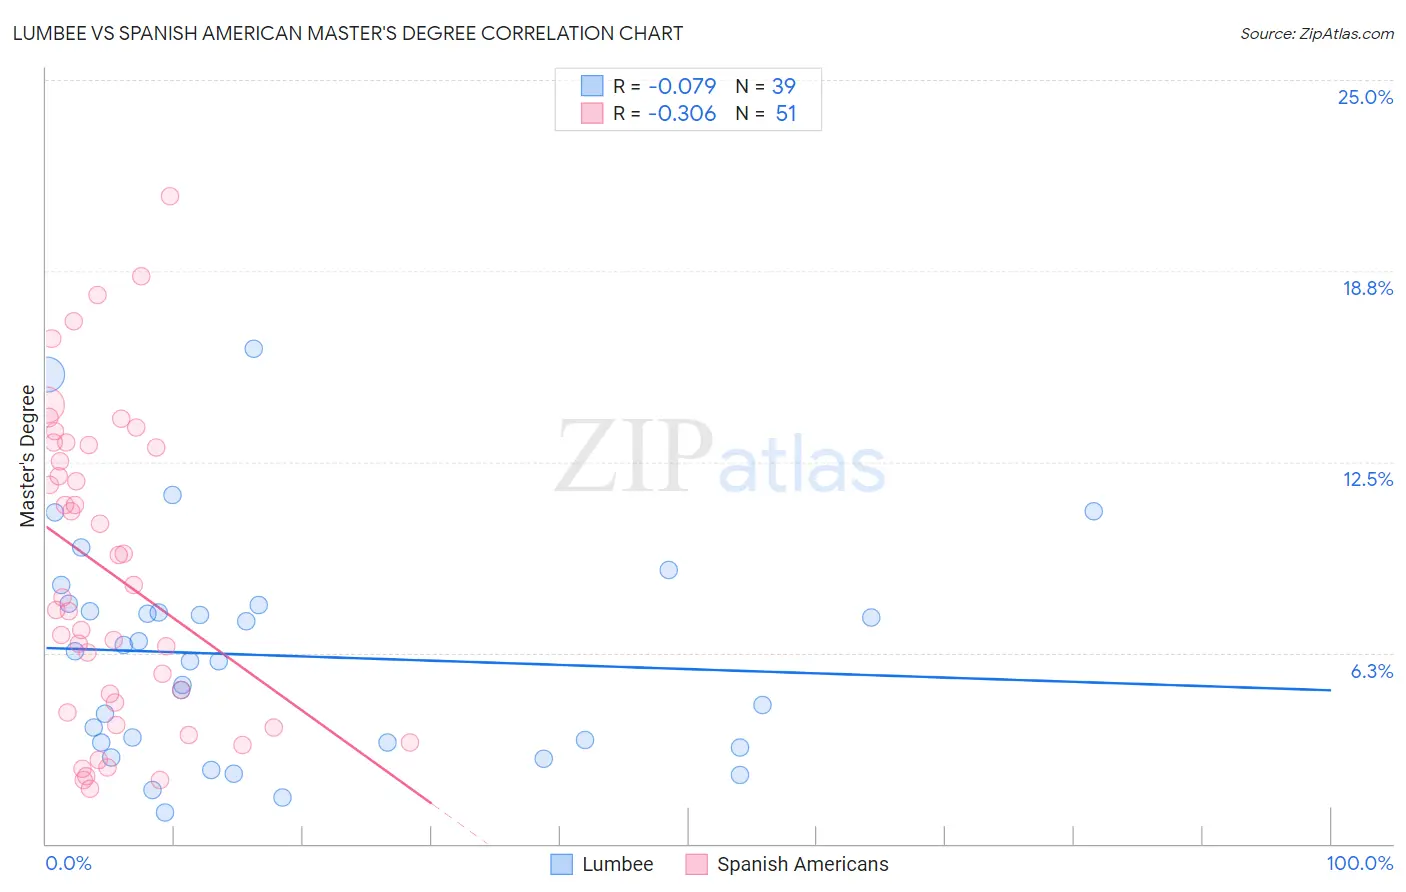
Lumbee vs Spanish American Master's Degree Correlation Chart
The statistical analysis conducted on geographies consisting of 92,286,127 people shows a slight negative correlation between the proportion of Lumbee and percentage of population with at least master's degree education in the United States with a correlation coefficient (R) of -0.079 and weighted average of 9.3%. Similarly, the statistical analysis conducted on geographies consisting of 103,160,270 people shows a mild negative correlation between the proportion of Spanish Americans and percentage of population with at least master's degree education in the United States with a correlation coefficient (R) of -0.306 and weighted average of 13.0%, a difference of 40.8%.
Master's Degree Correlation Summary
| Measurement | Lumbee | Spanish American |
| Minimum | 1.0% | 1.8% |
| Maximum | 16.2% | 21.2% |
| Range | 15.2% | 19.4% |
| Mean | 6.2% | 8.9% |
| Median | 6.0% | 8.0% |
| Interquartile 25% (IQ1) | 3.3% | 4.3% |
| Interquartile 75% (IQ3) | 7.8% | 13.1% |
| Interquartile Range (IQR) | 4.5% | 8.8% |
| Standard Deviation (Sample) | 3.6% | 5.0% |
| Standard Deviation (Population) | 3.5% | 5.0% |
Similar Demographics by Master's Degree
Demographics Similar to Lumbee by Master's Degree
In terms of master's degree, the demographic groups most similar to Lumbee are Pima (9.2%, a difference of 0.17%), Yuman (9.2%, a difference of 0.32%), Immigrants from Mexico (9.3%, a difference of 0.48%), Navajo (9.4%, a difference of 1.8%), and Yakama (9.5%, a difference of 2.1%).
| Demographics | Rating | Rank | Master's Degree |
| Menominee | 0.0 /100 | #333 | Tragic 10.2% |
| Arapaho | 0.0 /100 | #334 | Tragic 10.0% |
| Immigrants | Central America | 0.0 /100 | #335 | Tragic 10.0% |
| Natives/Alaskans | 0.0 /100 | #336 | Tragic 9.9% |
| Mexicans | 0.0 /100 | #337 | Tragic 9.7% |
| Tohono O'odham | 0.0 /100 | #338 | Tragic 9.7% |
| Spanish American Indians | 0.0 /100 | #339 | Tragic 9.6% |
| Yakama | 0.0 /100 | #340 | Tragic 9.5% |
| Navajo | 0.0 /100 | #341 | Tragic 9.4% |
| Immigrants | Mexico | 0.0 /100 | #342 | Tragic 9.3% |
| Lumbee | 0.0 /100 | #343 | Tragic 9.3% |
| Pima | 0.0 /100 | #344 | Tragic 9.2% |
| Yuman | 0.0 /100 | #345 | Tragic 9.2% |
| Yup'ik | 0.0 /100 | #346 | Tragic 8.5% |
| Houma | 0.0 /100 | #347 | Tragic 7.9% |
Demographics Similar to Spanish Americans by Master's Degree
In terms of master's degree, the demographic groups most similar to Spanish Americans are Immigrants from Jamaica (13.0%, a difference of 0.040%), U.S. Virgin Islander (13.1%, a difference of 0.28%), Delaware (13.0%, a difference of 0.42%), Guamanian/Chamorro (13.1%, a difference of 0.43%), and Immigrants from Bahamas (12.9%, a difference of 1.1%).
| Demographics | Rating | Rank | Master's Degree |
| German Russians | 4.5 /100 | #235 | Tragic 13.5% |
| Immigrants | Guyana | 4.4 /100 | #236 | Tragic 13.4% |
| Jamaicans | 4.1 /100 | #237 | Tragic 13.4% |
| Hmong | 4.0 /100 | #238 | Tragic 13.4% |
| Immigrants | Nonimmigrants | 3.4 /100 | #239 | Tragic 13.3% |
| Guamanians/Chamorros | 2.2 /100 | #240 | Tragic 13.1% |
| U.S. Virgin Islanders | 2.1 /100 | #241 | Tragic 13.1% |
| Spanish Americans | 1.9 /100 | #242 | Tragic 13.0% |
| Immigrants | Jamaica | 1.9 /100 | #243 | Tragic 13.0% |
| Delaware | 1.7 /100 | #244 | Tragic 13.0% |
| Immigrants | Bahamas | 1.4 /100 | #245 | Tragic 12.9% |
| Immigrants | Cambodia | 1.4 /100 | #246 | Tragic 12.9% |
| Iroquois | 1.4 /100 | #247 | Tragic 12.9% |
| Africans | 1.4 /100 | #248 | Tragic 12.9% |
| Cree | 1.3 /100 | #249 | Tragic 12.8% |