Immigrants from Eastern Asia vs Sierra Leonean 11th Grade
COMPARE
Immigrants from Eastern Asia
Sierra Leonean
11th Grade
11th Grade Comparison
Immigrants from Eastern Asia
Sierra Leoneans
92.7%
11TH GRADE
72.6/ 100
METRIC RATING
157th/ 347
METRIC RANK
92.6%
11TH GRADE
58.7/ 100
METRIC RATING
168th/ 347
METRIC RANK
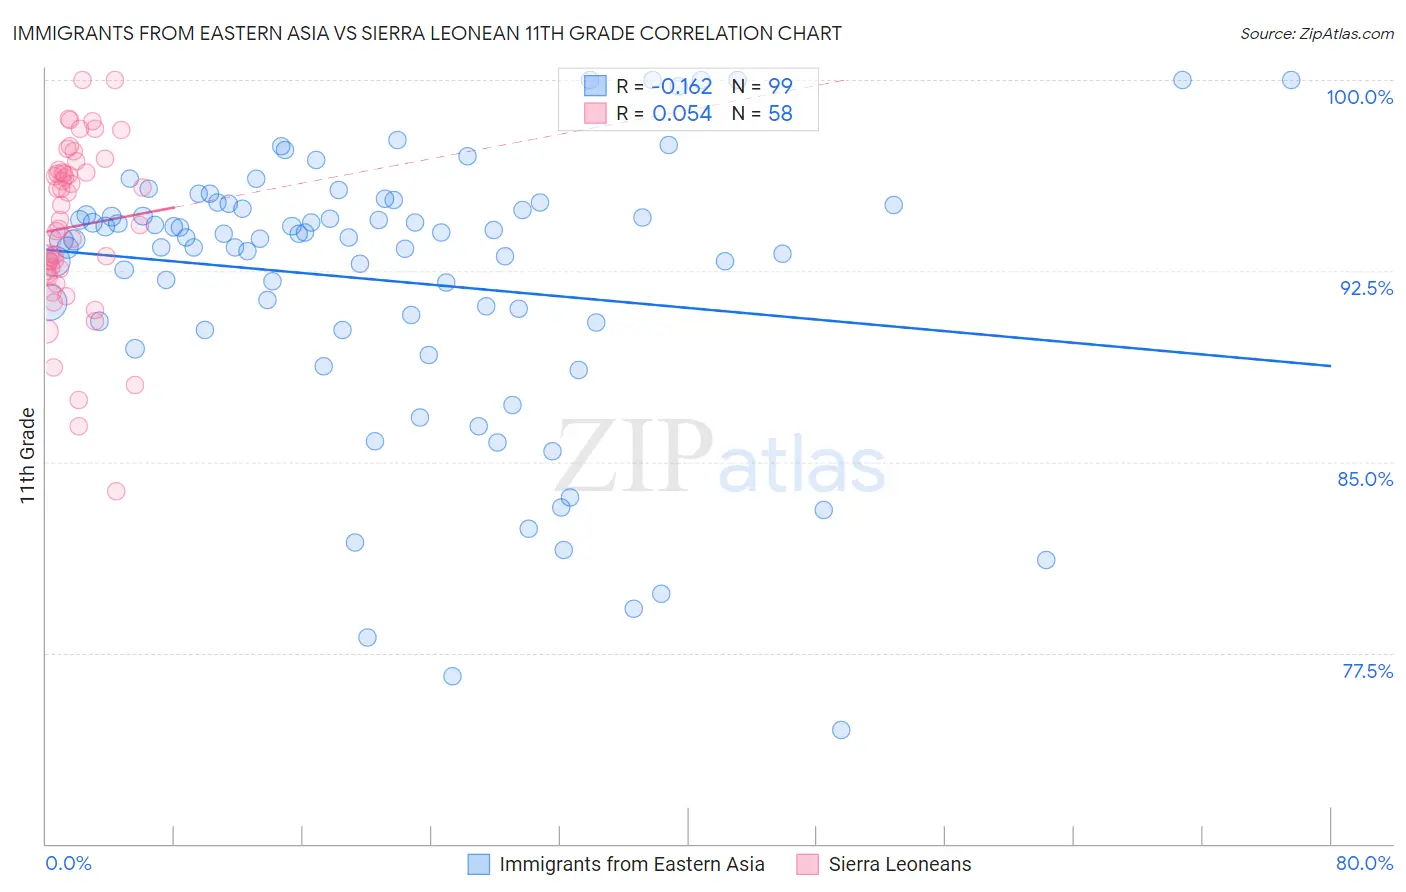
Immigrants from Eastern Asia vs Sierra Leonean 11th Grade Correlation Chart
The statistical analysis conducted on geographies consisting of 499,846,352 people shows a poor negative correlation between the proportion of Immigrants from Eastern Asia and percentage of population with at least 11th grade education in the United States with a correlation coefficient (R) of -0.162 and weighted average of 92.7%. Similarly, the statistical analysis conducted on geographies consisting of 83,355,497 people shows a slight positive correlation between the proportion of Sierra Leoneans and percentage of population with at least 11th grade education in the United States with a correlation coefficient (R) of 0.054 and weighted average of 92.6%, a difference of 0.15%.
11th Grade Correlation Summary
| Measurement | Immigrants from Eastern Asia | Sierra Leonean |
| Minimum | 74.5% | 83.9% |
| Maximum | 100.0% | 100.0% |
| Range | 25.5% | 16.1% |
| Mean | 92.1% | 94.2% |
| Median | 93.8% | 94.4% |
| Interquartile 25% (IQ1) | 90.5% | 92.5% |
| Interquartile 75% (IQ3) | 95.1% | 96.4% |
| Interquartile Range (IQR) | 4.6% | 3.9% |
| Standard Deviation (Sample) | 5.4% | 3.3% |
| Standard Deviation (Population) | 5.4% | 3.3% |
Demographics Similar to Immigrants from Eastern Asia and Sierra Leoneans by 11th Grade
In terms of 11th grade, the demographic groups most similar to Immigrants from Eastern Asia are Immigrants from Spain (92.7%, a difference of 0.0%), Osage (92.7%, a difference of 0.010%), Argentinean (92.7%, a difference of 0.010%), Immigrants from Venezuela (92.7%, a difference of 0.010%), and American (92.7%, a difference of 0.010%). Similarly, the demographic groups most similar to Sierra Leoneans are Immigrants from Albania (92.6%, a difference of 0.010%), Immigrants from Northern Africa (92.6%, a difference of 0.010%), Alsatian (92.6%, a difference of 0.020%), Bermudan (92.6%, a difference of 0.040%), and Laotian (92.6%, a difference of 0.040%).
| Demographics | Rating | Rank | 11th Grade |
| Iraqis | 74.2 /100 | #152 | Good 92.8% |
| Brazilians | 73.9 /100 | #153 | Good 92.8% |
| Osage | 73.4 /100 | #154 | Good 92.7% |
| Argentineans | 73.4 /100 | #155 | Good 92.7% |
| Immigrants | Spain | 73.0 /100 | #156 | Good 92.7% |
| Immigrants | Eastern Asia | 72.6 /100 | #157 | Good 92.7% |
| Immigrants | Venezuela | 72.0 /100 | #158 | Good 92.7% |
| Americans | 71.7 /100 | #159 | Good 92.7% |
| Immigrants | Lebanon | 70.7 /100 | #160 | Good 92.7% |
| Immigrants | Argentina | 69.8 /100 | #161 | Good 92.7% |
| Paraguayans | 68.7 /100 | #162 | Good 92.7% |
| Immigrants | Nonimmigrants | 66.6 /100 | #163 | Good 92.7% |
| Spanish | 66.2 /100 | #164 | Good 92.7% |
| Immigrants | Iraq | 63.7 /100 | #165 | Good 92.6% |
| Bermudans | 62.3 /100 | #166 | Good 92.6% |
| Alsatians | 60.2 /100 | #167 | Good 92.6% |
| Sierra Leoneans | 58.7 /100 | #168 | Average 92.6% |
| Immigrants | Albania | 57.8 /100 | #169 | Average 92.6% |
| Immigrants | Northern Africa | 57.3 /100 | #170 | Average 92.6% |
| Laotians | 54.4 /100 | #171 | Average 92.6% |
| Immigrants | Pakistan | 52.3 /100 | #172 | Average 92.5% |