Nonimmigrants vs Russian No Schooling Completed
COMPARE
Nonimmigrants
Russian
No Schooling Completed
No Schooling Completed Comparison
Nonimmigrants
Russians
1.8%
NO SCHOOLING COMPLETED
98.5/ 100
METRIC RATING
94th/ 347
METRIC RANK
1.7%
NO SCHOOLING COMPLETED
99.8/ 100
METRIC RATING
63rd/ 347
METRIC RANK
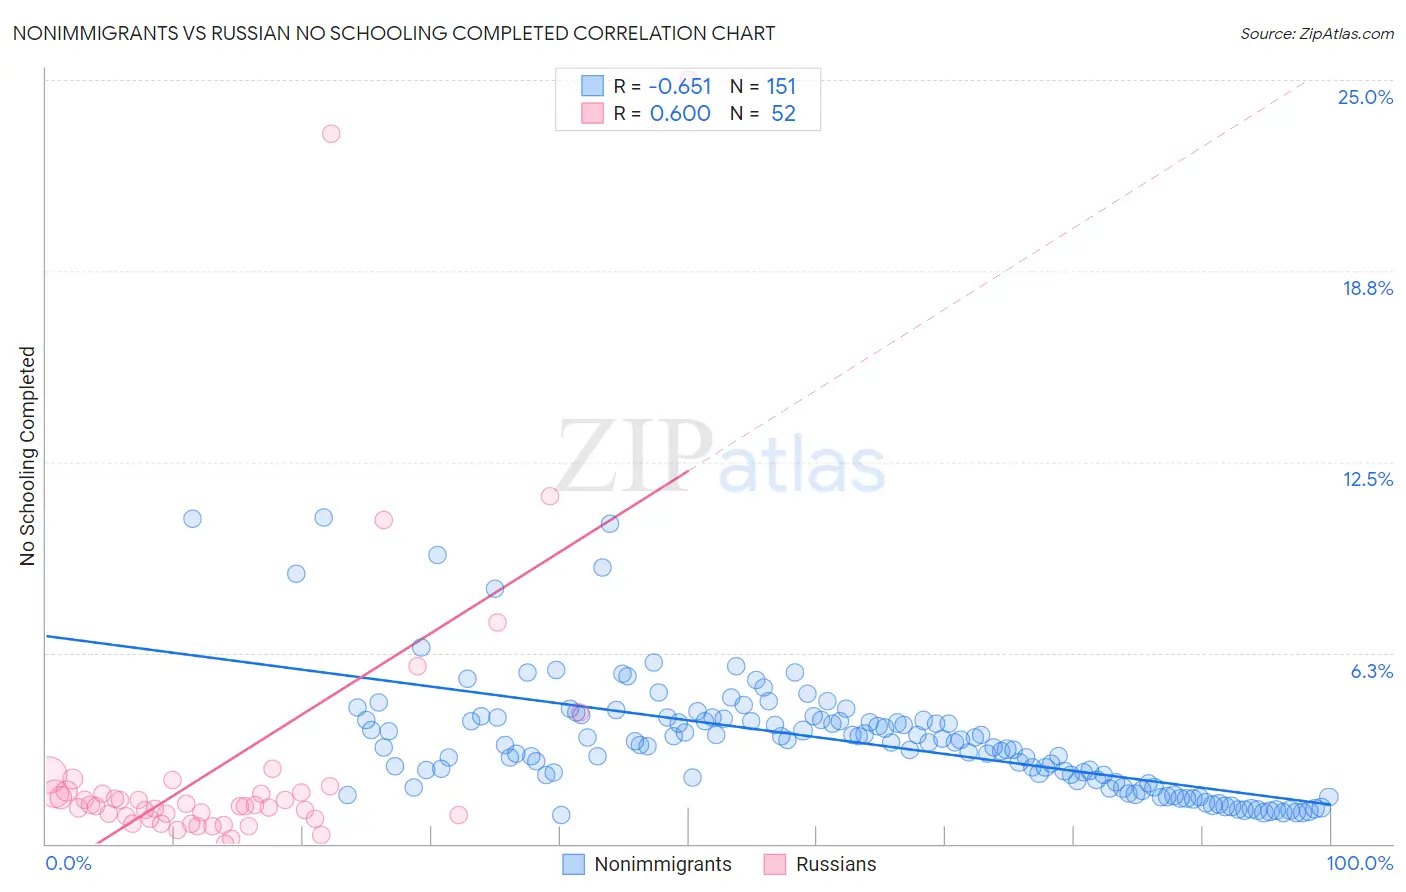
Nonimmigrants vs Russian No Schooling Completed Correlation Chart
The statistical analysis conducted on geographies consisting of 562,676,251 people shows a significant negative correlation between the proportion of Nonimmigrants and percentage of population with no schooling in the United States with a correlation coefficient (R) of -0.651 and weighted average of 1.8%. Similarly, the statistical analysis conducted on geographies consisting of 500,481,409 people shows a significant positive correlation between the proportion of Russians and percentage of population with no schooling in the United States with a correlation coefficient (R) of 0.600 and weighted average of 1.7%, a difference of 7.7%.
No Schooling Completed Correlation Summary
| Measurement | Nonimmigrants | Russian |
| Minimum | 0.93% | 0.017% |
| Maximum | 10.7% | 25.0% |
| Range | 9.8% | 25.0% |
| Mean | 3.4% | 2.7% |
| Median | 3.3% | 1.3% |
| Interquartile 25% (IQ1) | 2.0% | 0.87% |
| Interquartile 75% (IQ3) | 4.1% | 1.7% |
| Interquartile Range (IQR) | 2.1% | 0.83% |
| Standard Deviation (Sample) | 1.9% | 4.9% |
| Standard Deviation (Population) | 1.9% | 4.8% |
Similar Demographics by No Schooling Completed
Demographics Similar to Nonimmigrants by No Schooling Completed
In terms of no schooling completed, the demographic groups most similar to Nonimmigrants are Puget Sound Salish (1.8%, a difference of 0.010%), Bhutanese (1.8%, a difference of 0.24%), Immigrants from Ireland (1.8%, a difference of 0.42%), Turkish (1.8%, a difference of 0.50%), and Iranian (1.8%, a difference of 0.70%).
| Demographics | Rating | Rank | No Schooling Completed |
| Osage | 99.2 /100 | #87 | Exceptional 1.8% |
| Immigrants | Western Europe | 99.2 /100 | #88 | Exceptional 1.8% |
| South Africans | 99.1 /100 | #89 | Exceptional 1.8% |
| Sioux | 99.0 /100 | #90 | Exceptional 1.8% |
| Immigrants | Germany | 99.0 /100 | #91 | Exceptional 1.8% |
| Romanians | 98.8 /100 | #92 | Exceptional 1.8% |
| Turks | 98.7 /100 | #93 | Exceptional 1.8% |
| Immigrants | Nonimmigrants | 98.5 /100 | #94 | Exceptional 1.8% |
| Puget Sound Salish | 98.5 /100 | #95 | Exceptional 1.8% |
| Bhutanese | 98.4 /100 | #96 | Exceptional 1.8% |
| Immigrants | Ireland | 98.4 /100 | #97 | Exceptional 1.8% |
| Iranians | 98.2 /100 | #98 | Exceptional 1.8% |
| Choctaw | 98.1 /100 | #99 | Exceptional 1.8% |
| Immigrants | Singapore | 98.0 /100 | #100 | Exceptional 1.8% |
| Immigrants | Czechoslovakia | 97.9 /100 | #101 | Exceptional 1.8% |
Demographics Similar to Russians by No Schooling Completed
In terms of no schooling completed, the demographic groups most similar to Russians are Immigrants from Northern Europe (1.7%, a difference of 0.040%), New Zealander (1.7%, a difference of 0.16%), Serbian (1.7%, a difference of 0.20%), Canadian (1.7%, a difference of 0.34%), and Immigrants from Austria (1.7%, a difference of 0.53%).
| Demographics | Rating | Rank | No Schooling Completed |
| Immigrants | North America | 99.8 /100 | #56 | Exceptional 1.6% |
| Austrians | 99.8 /100 | #57 | Exceptional 1.6% |
| Kiowa | 99.8 /100 | #58 | Exceptional 1.6% |
| Slavs | 99.8 /100 | #59 | Exceptional 1.7% |
| Americans | 99.8 /100 | #60 | Exceptional 1.7% |
| Tsimshian | 99.8 /100 | #61 | Exceptional 1.7% |
| Immigrants | Northern Europe | 99.8 /100 | #62 | Exceptional 1.7% |
| Russians | 99.8 /100 | #63 | Exceptional 1.7% |
| New Zealanders | 99.7 /100 | #64 | Exceptional 1.7% |
| Serbians | 99.7 /100 | #65 | Exceptional 1.7% |
| Canadians | 99.7 /100 | #66 | Exceptional 1.7% |
| Immigrants | Austria | 99.7 /100 | #67 | Exceptional 1.7% |
| Immigrants | Lithuania | 99.7 /100 | #68 | Exceptional 1.7% |
| Chickasaw | 99.6 /100 | #69 | Exceptional 1.7% |
| Immigrants | Netherlands | 99.6 /100 | #70 | Exceptional 1.7% |