Lumbee vs Bolivian 4th Grade
COMPARE
Lumbee
Bolivian
4th Grade
4th Grade Comparison
Lumbee
Bolivians
98.0%
4TH GRADE
99.6/ 100
METRIC RATING
71st/ 347
METRIC RANK
97.1%
4TH GRADE
0.7/ 100
METRIC RATING
256th/ 347
METRIC RANK
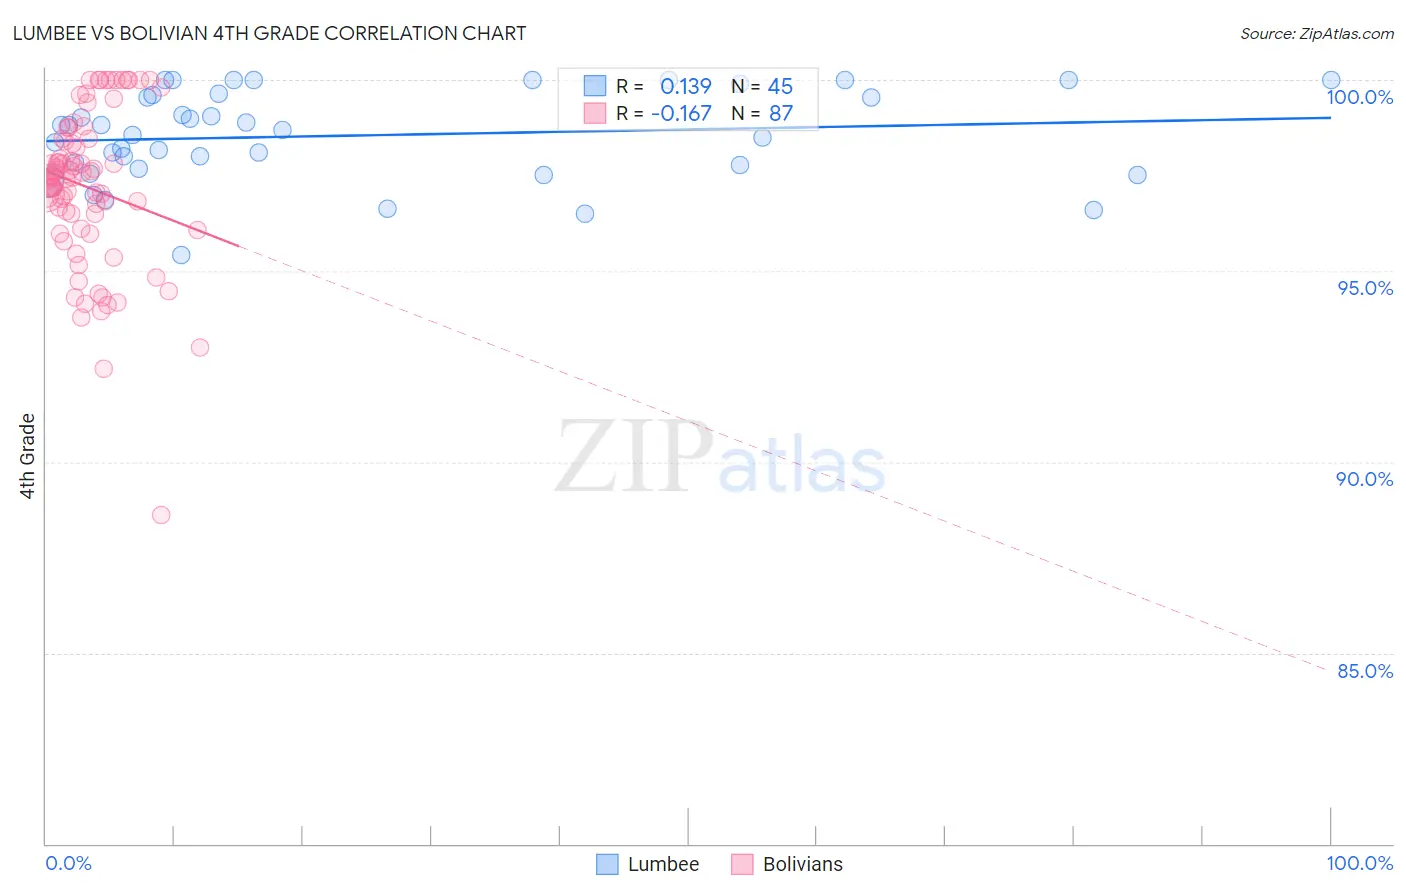
Lumbee vs Bolivian 4th Grade Correlation Chart
The statistical analysis conducted on geographies consisting of 92,298,549 people shows a poor positive correlation between the proportion of Lumbee and percentage of population with at least 4th grade education in the United States with a correlation coefficient (R) of 0.139 and weighted average of 98.0%. Similarly, the statistical analysis conducted on geographies consisting of 184,667,361 people shows a poor negative correlation between the proportion of Bolivians and percentage of population with at least 4th grade education in the United States with a correlation coefficient (R) of -0.167 and weighted average of 97.1%, a difference of 0.99%.
4th Grade Correlation Summary
| Measurement | Lumbee | Bolivian |
| Minimum | 95.4% | 88.6% |
| Maximum | 100.0% | 100.0% |
| Range | 4.6% | 11.4% |
| Mean | 98.5% | 97.2% |
| Median | 98.7% | 97.4% |
| Interquartile 25% (IQ1) | 97.7% | 96.1% |
| Interquartile 75% (IQ3) | 99.6% | 98.4% |
| Interquartile Range (IQR) | 1.9% | 2.4% |
| Standard Deviation (Sample) | 1.2% | 2.1% |
| Standard Deviation (Population) | 1.2% | 2.1% |
Similar Demographics by 4th Grade
Demographics Similar to Lumbee by 4th Grade
In terms of 4th grade, the demographic groups most similar to Lumbee are Kiowa (98.0%, a difference of 0.0%), Pueblo (98.0%, a difference of 0.0%), Immigrants from Austria (98.0%, a difference of 0.0%), Immigrants from Northern Europe (98.0%, a difference of 0.010%), and Canadian (98.0%, a difference of 0.010%).
| Demographics | Rating | Rank | 4th Grade |
| Cajuns | 99.7 /100 | #64 | Exceptional 98.0% |
| Immigrants | Northern Europe | 99.6 /100 | #65 | Exceptional 98.0% |
| Canadians | 99.6 /100 | #66 | Exceptional 98.0% |
| New Zealanders | 99.6 /100 | #67 | Exceptional 98.0% |
| Kiowa | 99.6 /100 | #68 | Exceptional 98.0% |
| Pueblo | 99.6 /100 | #69 | Exceptional 98.0% |
| Immigrants | Austria | 99.6 /100 | #70 | Exceptional 98.0% |
| Lumbee | 99.6 /100 | #71 | Exceptional 98.0% |
| Iranians | 99.4 /100 | #72 | Exceptional 98.0% |
| Macedonians | 99.4 /100 | #73 | Exceptional 98.0% |
| Chickasaw | 99.4 /100 | #74 | Exceptional 98.0% |
| Immigrants | Netherlands | 99.3 /100 | #75 | Exceptional 98.0% |
| Cherokee | 99.3 /100 | #76 | Exceptional 98.0% |
| Immigrants | Lithuania | 99.3 /100 | #77 | Exceptional 98.0% |
| Immigrants | England | 99.3 /100 | #78 | Exceptional 98.0% |
Demographics Similar to Bolivians by 4th Grade
In terms of 4th grade, the demographic groups most similar to Bolivians are Peruvian (97.1%, a difference of 0.0%), Immigrants from Middle Africa (97.1%, a difference of 0.010%), South American (97.1%, a difference of 0.020%), Jamaican (97.1%, a difference of 0.020%), and Immigrants from Liberia (97.1%, a difference of 0.020%).
| Demographics | Rating | Rank | 4th Grade |
| Immigrants | Africa | 1.0 /100 | #249 | Tragic 97.1% |
| Immigrants | Senegal | 0.9 /100 | #250 | Tragic 97.1% |
| South Americans | 0.8 /100 | #251 | Tragic 97.1% |
| Jamaicans | 0.8 /100 | #252 | Tragic 97.1% |
| Immigrants | Liberia | 0.8 /100 | #253 | Tragic 97.1% |
| Immigrants | Middle Africa | 0.8 /100 | #254 | Tragic 97.1% |
| Peruvians | 0.7 /100 | #255 | Tragic 97.1% |
| Bolivians | 0.7 /100 | #256 | Tragic 97.1% |
| Immigrants | Congo | 0.5 /100 | #257 | Tragic 97.0% |
| Immigrants | Colombia | 0.5 /100 | #258 | Tragic 97.0% |
| Immigrants | Ethiopia | 0.4 /100 | #259 | Tragic 97.0% |
| Immigrants | Sierra Leone | 0.4 /100 | #260 | Tragic 97.0% |
| Immigrants | South America | 0.4 /100 | #261 | Tragic 97.0% |
| West Indians | 0.4 /100 | #262 | Tragic 97.0% |
| Immigrants | Jamaica | 0.3 /100 | #263 | Tragic 97.0% |