Immigrants from Latin America vs Czech Professional Degree
COMPARE
Immigrants from Latin America
Czech
Professional Degree
Professional Degree Comparison
Immigrants from Latin America
Czechs
3.3%
PROFESSIONAL DEGREE
0.1/ 100
METRIC RATING
310th/ 347
METRIC RANK
4.4%
PROFESSIONAL DEGREE
44.9/ 100
METRIC RATING
180th/ 347
METRIC RANK
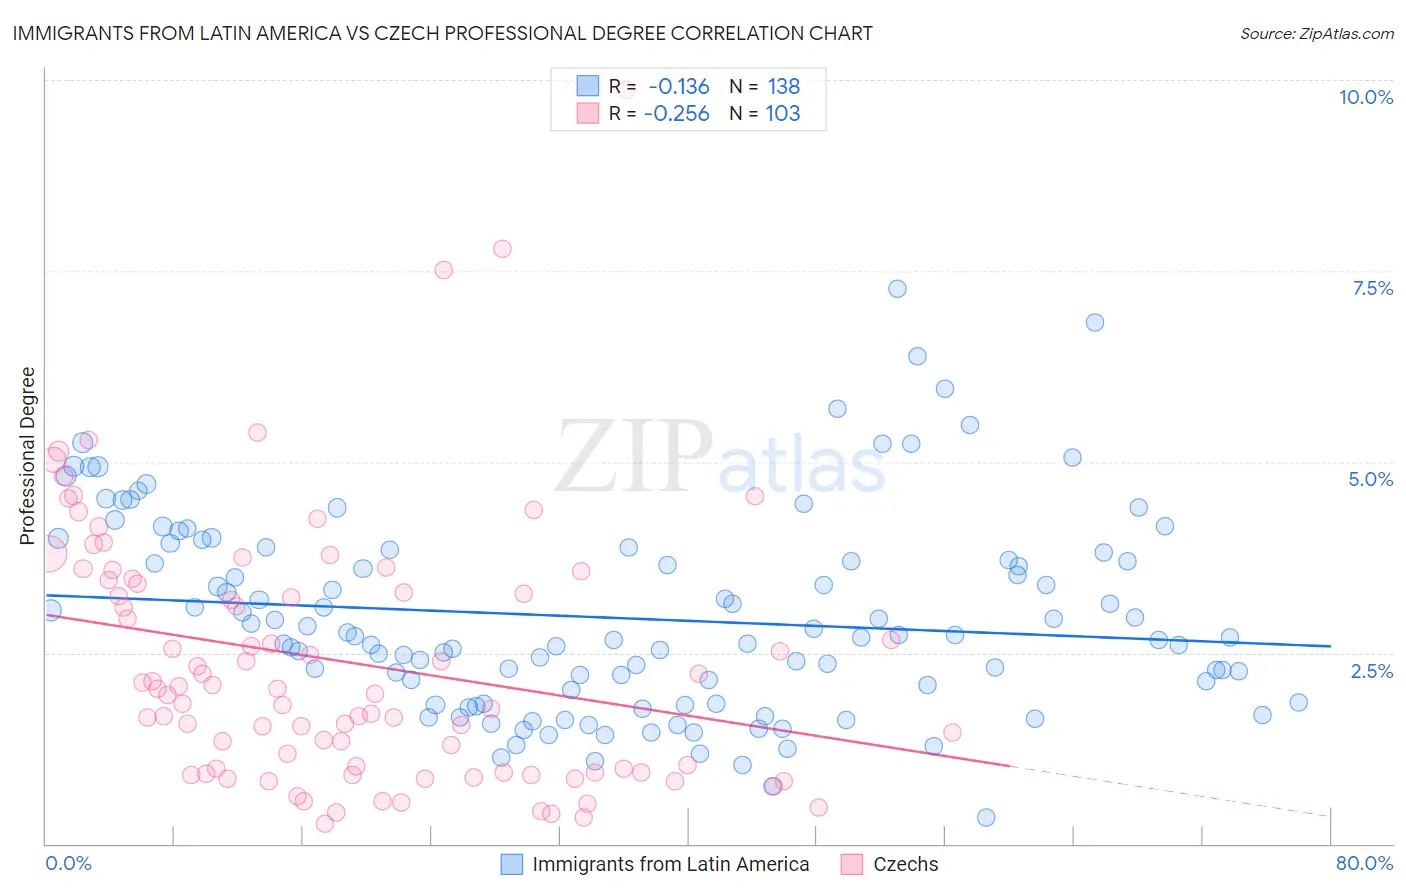
Immigrants from Latin America vs Czech Professional Degree Correlation Chart
The statistical analysis conducted on geographies consisting of 551,972,291 people shows a poor negative correlation between the proportion of Immigrants from Latin America and percentage of population with at least professional degree education in the United States with a correlation coefficient (R) of -0.136 and weighted average of 3.3%. Similarly, the statistical analysis conducted on geographies consisting of 481,986,557 people shows a weak negative correlation between the proportion of Czechs and percentage of population with at least professional degree education in the United States with a correlation coefficient (R) of -0.256 and weighted average of 4.4%, a difference of 32.6%.
Professional Degree Correlation Summary
| Measurement | Immigrants from Latin America | Czech |
| Minimum | 0.34% | 0.26% |
| Maximum | 7.3% | 9.9% |
| Range | 6.9% | 9.6% |
| Mean | 3.0% | 2.4% |
| Median | 2.7% | 2.0% |
| Interquartile 25% (IQ1) | 1.8% | 0.93% |
| Interquartile 75% (IQ3) | 3.8% | 3.5% |
| Interquartile Range (IQR) | 2.0% | 2.5% |
| Standard Deviation (Sample) | 1.3% | 1.7% |
| Standard Deviation (Population) | 1.3% | 1.7% |
Similar Demographics by Professional Degree
Demographics Similar to Immigrants from Latin America by Professional Degree
In terms of professional degree, the demographic groups most similar to Immigrants from Latin America are Cherokee (3.3%, a difference of 0.15%), Pima (3.3%, a difference of 0.32%), Shoshone (3.3%, a difference of 0.33%), Sioux (3.3%, a difference of 0.75%), and Yuman (3.3%, a difference of 0.76%).
| Demographics | Rating | Rank | Professional Degree |
| Immigrants | Haiti | 0.2 /100 | #303 | Tragic 3.4% |
| Cajuns | 0.2 /100 | #304 | Tragic 3.4% |
| Chickasaw | 0.1 /100 | #305 | Tragic 3.4% |
| Cape Verdeans | 0.1 /100 | #306 | Tragic 3.4% |
| Samoans | 0.1 /100 | #307 | Tragic 3.3% |
| Shoshone | 0.1 /100 | #308 | Tragic 3.3% |
| Pima | 0.1 /100 | #309 | Tragic 3.3% |
| Immigrants | Latin America | 0.1 /100 | #310 | Tragic 3.3% |
| Cherokee | 0.1 /100 | #311 | Tragic 3.3% |
| Sioux | 0.1 /100 | #312 | Tragic 3.3% |
| Yuman | 0.1 /100 | #313 | Tragic 3.3% |
| Mexican American Indians | 0.1 /100 | #314 | Tragic 3.3% |
| Immigrants | Laos | 0.1 /100 | #315 | Tragic 3.2% |
| Puerto Ricans | 0.1 /100 | #316 | Tragic 3.2% |
| Nepalese | 0.1 /100 | #317 | Tragic 3.2% |
Demographics Similar to Czechs by Professional Degree
In terms of professional degree, the demographic groups most similar to Czechs are Immigrants from Kenya (4.4%, a difference of 0.15%), Danish (4.4%, a difference of 0.22%), Immigrants from Costa Rica (4.4%, a difference of 0.26%), Immigrants (4.4%, a difference of 0.26%), and Bermudan (4.4%, a difference of 0.28%).
| Demographics | Rating | Rank | Professional Degree |
| English | 50.1 /100 | #173 | Average 4.4% |
| Kenyans | 50.0 /100 | #174 | Average 4.4% |
| Irish | 50.0 /100 | #175 | Average 4.4% |
| Immigrants | Peru | 49.3 /100 | #176 | Average 4.4% |
| Celtics | 47.6 /100 | #177 | Average 4.4% |
| Immigrants | Costa Rica | 46.7 /100 | #178 | Average 4.4% |
| Immigrants | Kenya | 45.9 /100 | #179 | Average 4.4% |
| Czechs | 44.9 /100 | #180 | Average 4.4% |
| Danes | 43.5 /100 | #181 | Average 4.4% |
| Immigrants | Immigrants | 43.2 /100 | #182 | Average 4.4% |
| Bermudans | 43.1 /100 | #183 | Average 4.4% |
| Belgians | 36.2 /100 | #184 | Fair 4.3% |
| Welsh | 35.8 /100 | #185 | Fair 4.3% |
| Scotch-Irish | 34.2 /100 | #186 | Fair 4.3% |
| Immigrants | Cameroon | 33.3 /100 | #187 | Fair 4.3% |