Burmese vs Spanish 8th Grade
COMPARE
Burmese
Spanish
8th Grade
8th Grade Comparison
Burmese
Spanish
96.1%
8TH GRADE
90.2/ 100
METRIC RATING
138th/ 347
METRIC RANK
96.0%
8TH GRADE
85.1/ 100
METRIC RATING
143rd/ 347
METRIC RANK
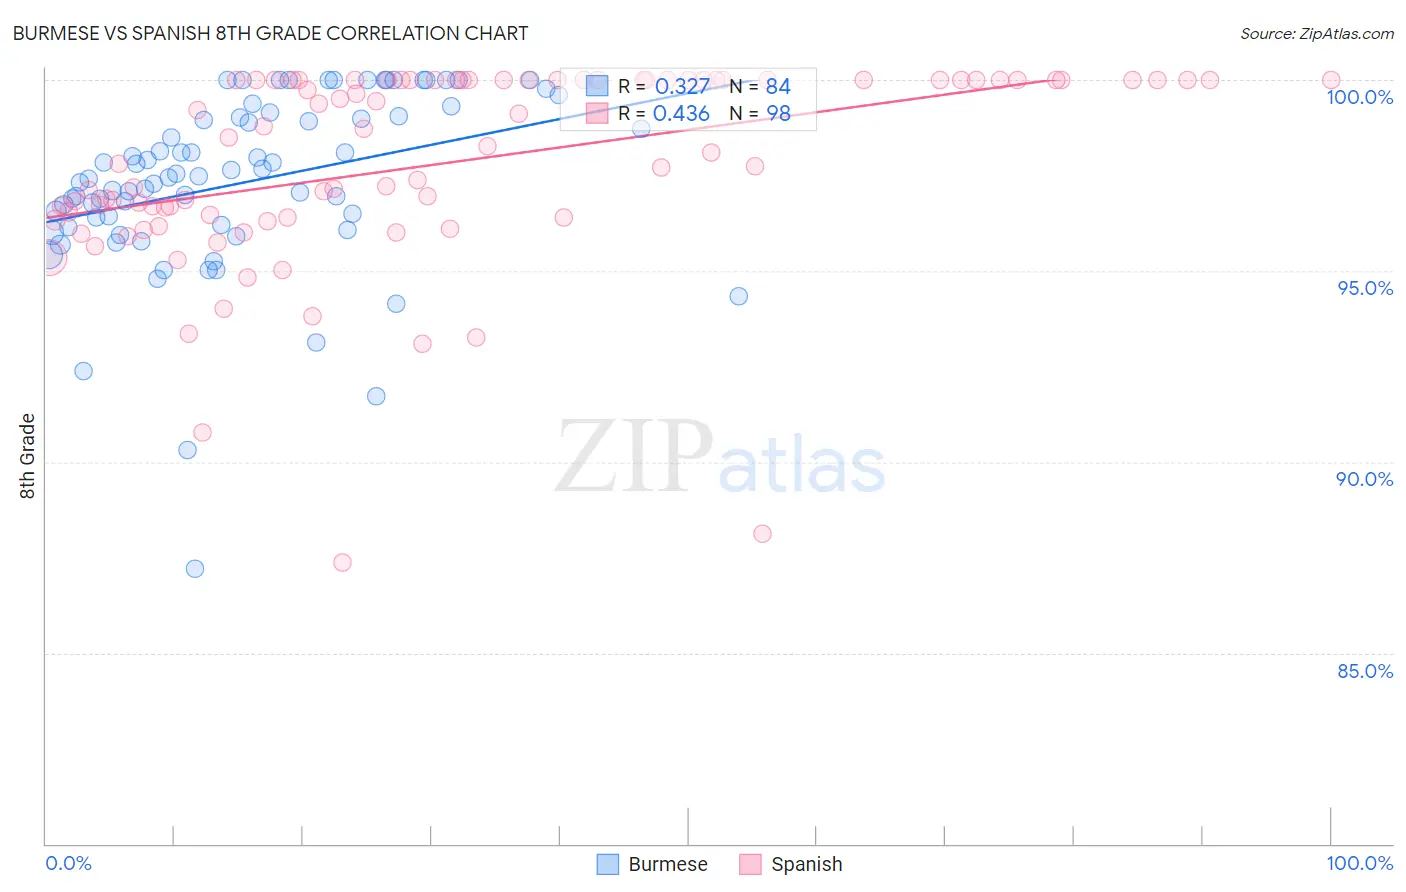
Burmese vs Spanish 8th Grade Correlation Chart
The statistical analysis conducted on geographies consisting of 465,275,888 people shows a mild positive correlation between the proportion of Burmese and percentage of population with at least 8th grade education in the United States with a correlation coefficient (R) of 0.327 and weighted average of 96.1%. Similarly, the statistical analysis conducted on geographies consisting of 422,189,188 people shows a moderate positive correlation between the proportion of Spanish and percentage of population with at least 8th grade education in the United States with a correlation coefficient (R) of 0.436 and weighted average of 96.0%, a difference of 0.080%.
8th Grade Correlation Summary
| Measurement | Burmese | Spanish |
| Minimum | 87.2% | 87.4% |
| Maximum | 100.0% | 100.0% |
| Range | 12.8% | 12.6% |
| Mean | 97.3% | 97.8% |
| Median | 97.5% | 98.4% |
| Interquartile 25% (IQ1) | 96.2% | 96.4% |
| Interquartile 75% (IQ3) | 99.0% | 100.0% |
| Interquartile Range (IQR) | 2.8% | 3.6% |
| Standard Deviation (Sample) | 2.3% | 2.6% |
| Standard Deviation (Population) | 2.3% | 2.6% |
Demographics Similar to Burmese and Spanish by 8th Grade
In terms of 8th grade, the demographic groups most similar to Burmese are Cambodian (96.1%, a difference of 0.010%), Hmong (96.1%, a difference of 0.010%), Immigrants from South Central Asia (96.1%, a difference of 0.010%), Basque (96.1%, a difference of 0.020%), and Jordanian (96.1%, a difference of 0.020%). Similarly, the demographic groups most similar to Spanish are Immigrants from Eastern Europe (96.0%, a difference of 0.0%), Immigrants from Belarus (96.0%, a difference of 0.0%), Immigrants from Greece (96.0%, a difference of 0.010%), Lumbee (96.0%, a difference of 0.010%), and Israeli (96.0%, a difference of 0.010%).
| Demographics | Rating | Rank | 8th Grade |
| Soviet Union | 92.6 /100 | #130 | Exceptional 96.1% |
| Pueblo | 92.3 /100 | #131 | Exceptional 96.1% |
| Immigrants | Kuwait | 92.2 /100 | #132 | Exceptional 96.1% |
| Immigrants | Turkey | 91.7 /100 | #133 | Exceptional 96.1% |
| Immigrants | Hungary | 91.5 /100 | #134 | Exceptional 96.1% |
| Basques | 91.5 /100 | #135 | Exceptional 96.1% |
| Jordanians | 91.3 /100 | #136 | Exceptional 96.1% |
| Cambodians | 90.6 /100 | #137 | Exceptional 96.1% |
| Burmese | 90.2 /100 | #138 | Exceptional 96.1% |
| Hmong | 89.7 /100 | #139 | Excellent 96.1% |
| Immigrants | South Central Asia | 89.4 /100 | #140 | Excellent 96.1% |
| Immigrants | Greece | 85.9 /100 | #141 | Excellent 96.0% |
| Immigrants | Eastern Europe | 85.4 /100 | #142 | Excellent 96.0% |
| Spanish | 85.1 /100 | #143 | Excellent 96.0% |
| Immigrants | Belarus | 84.8 /100 | #144 | Excellent 96.0% |
| Lumbee | 84.1 /100 | #145 | Excellent 96.0% |
| Israelis | 84.1 /100 | #146 | Excellent 96.0% |
| Colville | 84.0 /100 | #147 | Excellent 96.0% |
| Albanians | 83.1 /100 | #148 | Excellent 96.0% |
| Immigrants | Israel | 81.3 /100 | #149 | Excellent 96.0% |
| Immigrants | Russia | 80.9 /100 | #150 | Excellent 96.0% |