Immigrants from Central America vs Immigrants from Uganda Master's Degree
COMPARE
Immigrants from Central America
Immigrants from Uganda
Master's Degree
Master's Degree Comparison
Immigrants from Central America
Immigrants from Uganda
10.0%
MASTER'S DEGREE
0.0/ 100
METRIC RATING
335th/ 347
METRIC RANK
16.6%
MASTER'S DEGREE
97.3/ 100
METRIC RATING
115th/ 347
METRIC RANK
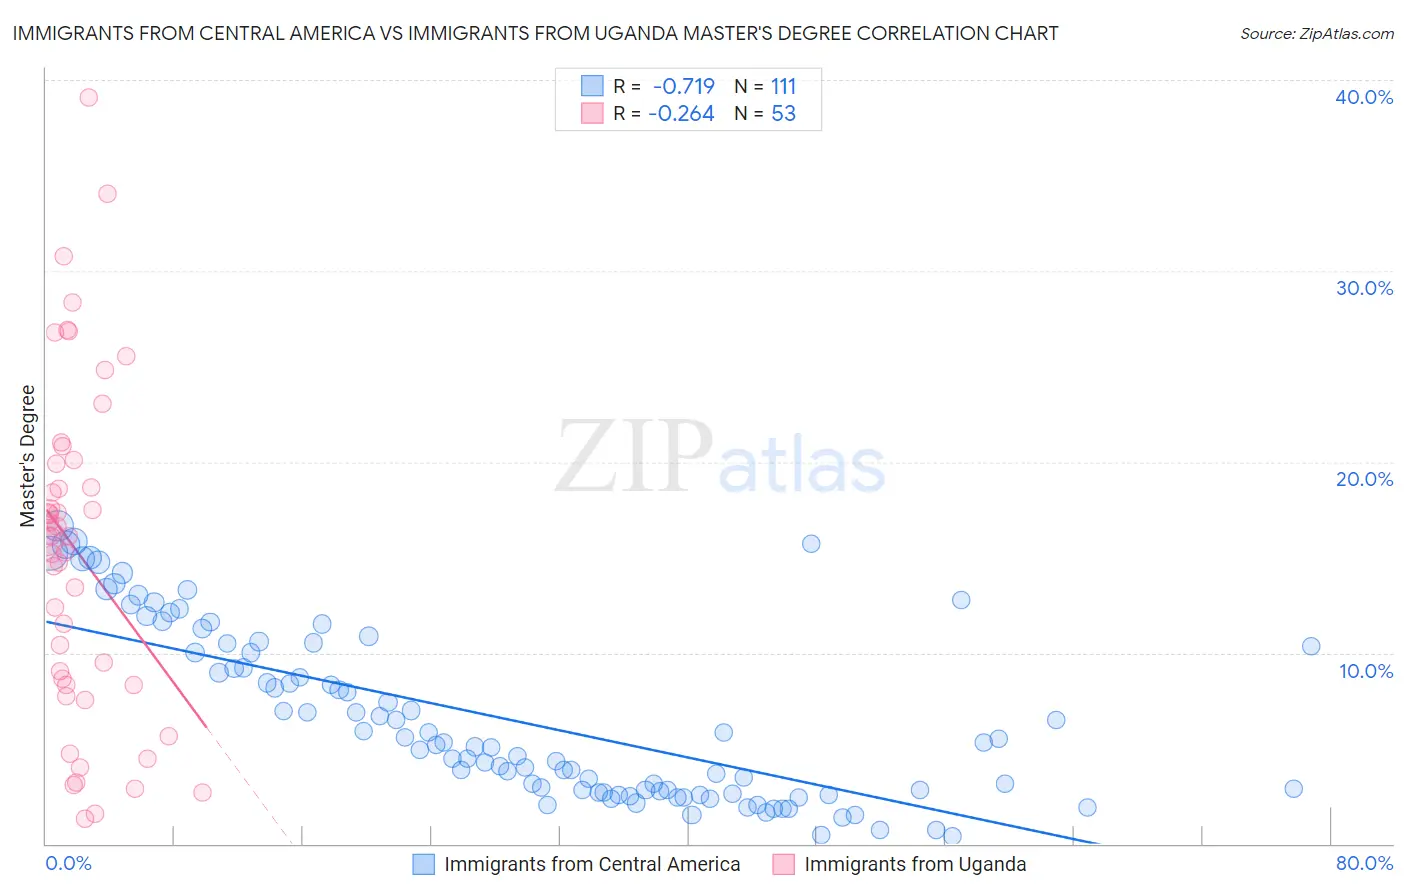
Immigrants from Central America vs Immigrants from Uganda Master's Degree Correlation Chart
The statistical analysis conducted on geographies consisting of 535,778,431 people shows a strong negative correlation between the proportion of Immigrants from Central America and percentage of population with at least master's degree education in the United States with a correlation coefficient (R) of -0.719 and weighted average of 10.0%. Similarly, the statistical analysis conducted on geographies consisting of 125,956,519 people shows a weak negative correlation between the proportion of Immigrants from Uganda and percentage of population with at least master's degree education in the United States with a correlation coefficient (R) of -0.264 and weighted average of 16.6%, a difference of 66.7%.
Master's Degree Correlation Summary
| Measurement | Immigrants from Central America | Immigrants from Uganda |
| Minimum | 0.37% | 1.3% |
| Maximum | 16.7% | 39.1% |
| Range | 16.3% | 37.8% |
| Mean | 6.5% | 15.3% |
| Median | 5.2% | 16.1% |
| Interquartile 25% (IQ1) | 2.7% | 8.3% |
| Interquartile 75% (IQ3) | 10.3% | 20.0% |
| Interquartile Range (IQR) | 7.6% | 11.7% |
| Standard Deviation (Sample) | 4.5% | 8.7% |
| Standard Deviation (Population) | 4.4% | 8.7% |
Similar Demographics by Master's Degree
Demographics Similar to Immigrants from Central America by Master's Degree
In terms of master's degree, the demographic groups most similar to Immigrants from Central America are Arapaho (10.0%, a difference of 0.13%), Native/Alaskan (9.9%, a difference of 0.50%), Menominee (10.2%, a difference of 2.1%), Immigrants from the Azores (10.2%, a difference of 2.5%), and Mexican (9.7%, a difference of 2.8%).
| Demographics | Rating | Rank | Master's Degree |
| Bangladeshis | 0.0 /100 | #328 | Tragic 10.5% |
| Nepalese | 0.0 /100 | #329 | Tragic 10.5% |
| Fijians | 0.0 /100 | #330 | Tragic 10.3% |
| Pueblo | 0.0 /100 | #331 | Tragic 10.3% |
| Immigrants | Azores | 0.0 /100 | #332 | Tragic 10.2% |
| Menominee | 0.0 /100 | #333 | Tragic 10.2% |
| Arapaho | 0.0 /100 | #334 | Tragic 10.0% |
| Immigrants | Central America | 0.0 /100 | #335 | Tragic 10.0% |
| Natives/Alaskans | 0.0 /100 | #336 | Tragic 9.9% |
| Mexicans | 0.0 /100 | #337 | Tragic 9.7% |
| Tohono O'odham | 0.0 /100 | #338 | Tragic 9.7% |
| Spanish American Indians | 0.0 /100 | #339 | Tragic 9.6% |
| Yakama | 0.0 /100 | #340 | Tragic 9.5% |
| Navajo | 0.0 /100 | #341 | Tragic 9.4% |
| Immigrants | Mexico | 0.0 /100 | #342 | Tragic 9.3% |
Demographics Similar to Immigrants from Uganda by Master's Degree
In terms of master's degree, the demographic groups most similar to Immigrants from Uganda are Immigrants from Southern Europe (16.6%, a difference of 0.12%), Immigrants from Moldova (16.6%, a difference of 0.13%), Northern European (16.7%, a difference of 0.30%), Arab (16.7%, a difference of 0.37%), and Macedonian (16.7%, a difference of 0.38%).
| Demographics | Rating | Rank | Master's Degree |
| Sierra Leoneans | 98.0 /100 | #108 | Exceptional 16.8% |
| Moroccans | 98.0 /100 | #109 | Exceptional 16.8% |
| Immigrants | Chile | 98.0 /100 | #110 | Exceptional 16.8% |
| Austrians | 97.8 /100 | #111 | Exceptional 16.7% |
| Macedonians | 97.7 /100 | #112 | Exceptional 16.7% |
| Arabs | 97.7 /100 | #113 | Exceptional 16.7% |
| Northern Europeans | 97.6 /100 | #114 | Exceptional 16.7% |
| Immigrants | Uganda | 97.3 /100 | #115 | Exceptional 16.6% |
| Immigrants | Southern Europe | 97.2 /100 | #116 | Exceptional 16.6% |
| Immigrants | Moldova | 97.2 /100 | #117 | Exceptional 16.6% |
| Brazilians | 96.8 /100 | #118 | Exceptional 16.5% |
| Jordanians | 96.5 /100 | #119 | Exceptional 16.5% |
| Lebanese | 96.4 /100 | #120 | Exceptional 16.5% |
| Afghans | 96.2 /100 | #121 | Exceptional 16.5% |
| British | 95.6 /100 | #122 | Exceptional 16.4% |