Immigrants from Senegal vs Immigrants from Italy 8th Grade
COMPARE
Immigrants from Senegal
Immigrants from Italy
8th Grade
8th Grade Comparison
Immigrants from Senegal
Immigrants from Italy
95.1%
8TH GRADE
1.4/ 100
METRIC RATING
247th/ 347
METRIC RANK
95.8%
8TH GRADE
63.5/ 100
METRIC RATING
164th/ 347
METRIC RANK
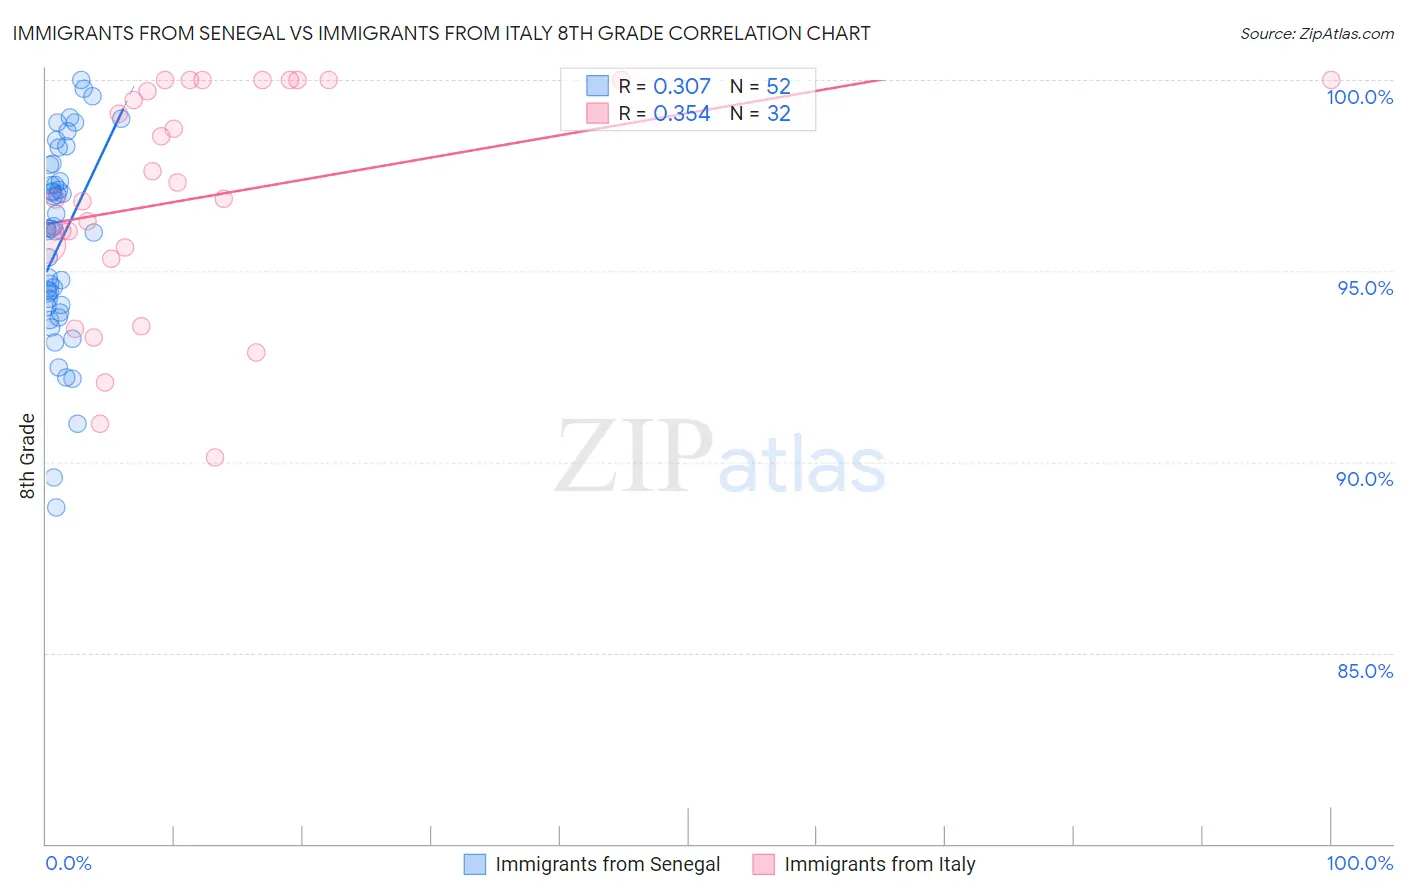
Immigrants from Senegal vs Immigrants from Italy 8th Grade Correlation Chart
The statistical analysis conducted on geographies consisting of 90,130,297 people shows a mild positive correlation between the proportion of Immigrants from Senegal and percentage of population with at least 8th grade education in the United States with a correlation coefficient (R) of 0.307 and weighted average of 95.1%. Similarly, the statistical analysis conducted on geographies consisting of 324,226,009 people shows a mild positive correlation between the proportion of Immigrants from Italy and percentage of population with at least 8th grade education in the United States with a correlation coefficient (R) of 0.354 and weighted average of 95.8%, a difference of 0.79%.
8th Grade Correlation Summary
| Measurement | Immigrants from Senegal | Immigrants from Italy |
| Minimum | 88.8% | 90.1% |
| Maximum | 100.0% | 100.0% |
| Range | 11.2% | 9.9% |
| Mean | 95.7% | 97.0% |
| Median | 96.1% | 97.1% |
| Interquartile 25% (IQ1) | 94.1% | 95.5% |
| Interquartile 75% (IQ3) | 97.6% | 100.0% |
| Interquartile Range (IQR) | 3.5% | 4.5% |
| Standard Deviation (Sample) | 2.6% | 3.0% |
| Standard Deviation (Population) | 2.5% | 2.9% |
Similar Demographics by 8th Grade
Demographics Similar to Immigrants from Senegal by 8th Grade
In terms of 8th grade, the demographic groups most similar to Immigrants from Senegal are Somali (95.1%, a difference of 0.0%), Jamaican (95.1%, a difference of 0.010%), Uruguayan (95.1%, a difference of 0.010%), Tongan (95.1%, a difference of 0.040%), and Paiute (95.1%, a difference of 0.040%).
| Demographics | Rating | Rank | 8th Grade |
| Ethiopians | 2.0 /100 | #240 | Tragic 95.1% |
| South American Indians | 1.9 /100 | #241 | Tragic 95.1% |
| Tongans | 1.7 /100 | #242 | Tragic 95.1% |
| Paiute | 1.7 /100 | #243 | Tragic 95.1% |
| Immigrants | Middle Africa | 1.7 /100 | #244 | Tragic 95.1% |
| Jamaicans | 1.4 /100 | #245 | Tragic 95.1% |
| Somalis | 1.4 /100 | #246 | Tragic 95.1% |
| Immigrants | Senegal | 1.4 /100 | #247 | Tragic 95.1% |
| Uruguayans | 1.2 /100 | #248 | Tragic 95.1% |
| Immigrants | China | 1.1 /100 | #249 | Tragic 95.0% |
| Koreans | 1.1 /100 | #250 | Tragic 95.0% |
| Bolivians | 1.0 /100 | #251 | Tragic 95.0% |
| Immigrants | Ethiopia | 1.0 /100 | #252 | Tragic 95.0% |
| U.S. Virgin Islanders | 0.9 /100 | #253 | Tragic 95.0% |
| Immigrants | Cameroon | 0.8 /100 | #254 | Tragic 95.0% |
Demographics Similar to Immigrants from Italy by 8th Grade
In terms of 8th grade, the demographic groups most similar to Immigrants from Italy are Immigrants from Sri Lanka (95.8%, a difference of 0.0%), Alsatian (95.8%, a difference of 0.010%), Immigrants from Poland (95.8%, a difference of 0.020%), Spaniard (95.8%, a difference of 0.020%), and Seminole (95.8%, a difference of 0.030%).
| Demographics | Rating | Rank | 8th Grade |
| Immigrants | Taiwan | 70.5 /100 | #157 | Good 95.9% |
| Arabs | 69.4 /100 | #158 | Good 95.9% |
| Immigrants | Kazakhstan | 68.4 /100 | #159 | Good 95.9% |
| Seminole | 67.7 /100 | #160 | Good 95.8% |
| Bermudans | 67.5 /100 | #161 | Good 95.8% |
| Immigrants | Kenya | 67.2 /100 | #162 | Good 95.8% |
| Immigrants | Sri Lanka | 64.1 /100 | #163 | Good 95.8% |
| Immigrants | Italy | 63.5 /100 | #164 | Good 95.8% |
| Alsatians | 61.4 /100 | #165 | Good 95.8% |
| Immigrants | Poland | 61.1 /100 | #166 | Good 95.8% |
| Spaniards | 60.0 /100 | #167 | Good 95.8% |
| Immigrants | Ukraine | 59.5 /100 | #168 | Average 95.8% |
| Immigrants | Iran | 58.6 /100 | #169 | Average 95.8% |
| Ute | 58.5 /100 | #170 | Average 95.8% |
| Egyptians | 58.2 /100 | #171 | Average 95.8% |