Immigrants from Egypt vs Immigrants from Italy 8th Grade
COMPARE
Immigrants from Egypt
Immigrants from Italy
8th Grade
8th Grade Comparison
Immigrants from Egypt
Immigrants from Italy
95.7%
8TH GRADE
37.9/ 100
METRIC RATING
182nd/ 347
METRIC RANK
95.8%
8TH GRADE
63.5/ 100
METRIC RATING
164th/ 347
METRIC RANK
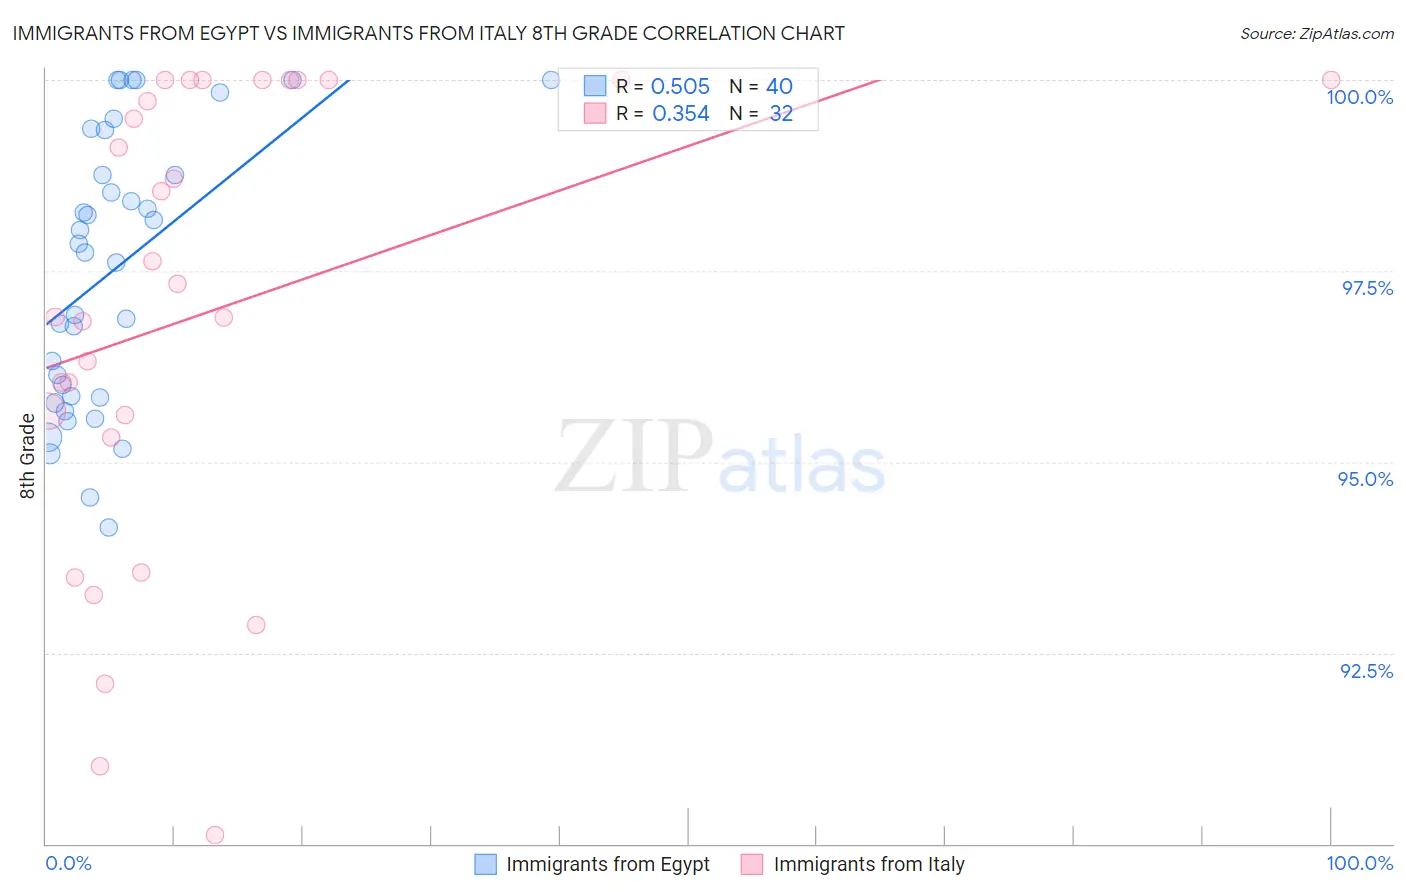
Immigrants from Egypt vs Immigrants from Italy 8th Grade Correlation Chart
The statistical analysis conducted on geographies consisting of 245,484,455 people shows a substantial positive correlation between the proportion of Immigrants from Egypt and percentage of population with at least 8th grade education in the United States with a correlation coefficient (R) of 0.505 and weighted average of 95.7%. Similarly, the statistical analysis conducted on geographies consisting of 324,226,009 people shows a mild positive correlation between the proportion of Immigrants from Italy and percentage of population with at least 8th grade education in the United States with a correlation coefficient (R) of 0.354 and weighted average of 95.8%, a difference of 0.17%.
8th Grade Correlation Summary
| Measurement | Immigrants from Egypt | Immigrants from Italy |
| Minimum | 94.1% | 90.1% |
| Maximum | 100.0% | 100.0% |
| Range | 5.9% | 9.9% |
| Mean | 97.5% | 97.0% |
| Median | 97.8% | 97.1% |
| Interquartile 25% (IQ1) | 95.8% | 95.5% |
| Interquartile 75% (IQ3) | 99.1% | 100.0% |
| Interquartile Range (IQR) | 3.2% | 4.5% |
| Standard Deviation (Sample) | 1.8% | 3.0% |
| Standard Deviation (Population) | 1.8% | 2.9% |
Demographics Similar to Immigrants from Egypt and Immigrants from Italy by 8th Grade
In terms of 8th grade, the demographic groups most similar to Immigrants from Egypt are Immigrants from Spain (95.7%, a difference of 0.010%), Immigrants from Iraq (95.6%, a difference of 0.010%), Iraqi (95.7%, a difference of 0.020%), Immigrants from Brazil (95.7%, a difference of 0.050%), and Venezuelan (95.7%, a difference of 0.060%). Similarly, the demographic groups most similar to Immigrants from Italy are Immigrants from Sri Lanka (95.8%, a difference of 0.0%), Alsatian (95.8%, a difference of 0.010%), Immigrants from Poland (95.8%, a difference of 0.020%), Spaniard (95.8%, a difference of 0.020%), and Immigrants from Ukraine (95.8%, a difference of 0.030%).
| Demographics | Rating | Rank | 8th Grade |
| Immigrants | Sri Lanka | 64.1 /100 | #163 | Good 95.8% |
| Immigrants | Italy | 63.5 /100 | #164 | Good 95.8% |
| Alsatians | 61.4 /100 | #165 | Good 95.8% |
| Immigrants | Poland | 61.1 /100 | #166 | Good 95.8% |
| Spaniards | 60.0 /100 | #167 | Good 95.8% |
| Immigrants | Ukraine | 59.5 /100 | #168 | Average 95.8% |
| Immigrants | Iran | 58.6 /100 | #169 | Average 95.8% |
| Ute | 58.5 /100 | #170 | Average 95.8% |
| Egyptians | 58.2 /100 | #171 | Average 95.8% |
| Immigrants | Korea | 57.9 /100 | #172 | Average 95.8% |
| Mongolians | 53.0 /100 | #173 | Average 95.8% |
| Chileans | 50.0 /100 | #174 | Average 95.7% |
| Immigrants | Albania | 49.6 /100 | #175 | Average 95.7% |
| Pakistanis | 48.8 /100 | #176 | Average 95.7% |
| Marshallese | 47.6 /100 | #177 | Average 95.7% |
| Venezuelans | 47.5 /100 | #178 | Average 95.7% |
| Immigrants | Brazil | 45.4 /100 | #179 | Average 95.7% |
| Iraqis | 40.5 /100 | #180 | Average 95.7% |
| Immigrants | Spain | 38.7 /100 | #181 | Fair 95.7% |
| Immigrants | Egypt | 37.9 /100 | #182 | Fair 95.7% |
| Immigrants | Iraq | 36.2 /100 | #183 | Fair 95.6% |