Immigrants from Bahamas vs Haitian 7th Grade
COMPARE
Immigrants from Bahamas
Haitian
7th Grade
7th Grade Comparison
Immigrants from Bahamas
Haitians
95.9%
7TH GRADE
30.8/ 100
METRIC RATING
193rd/ 347
METRIC RANK
94.7%
7TH GRADE
0.0/ 100
METRIC RATING
294th/ 347
METRIC RANK
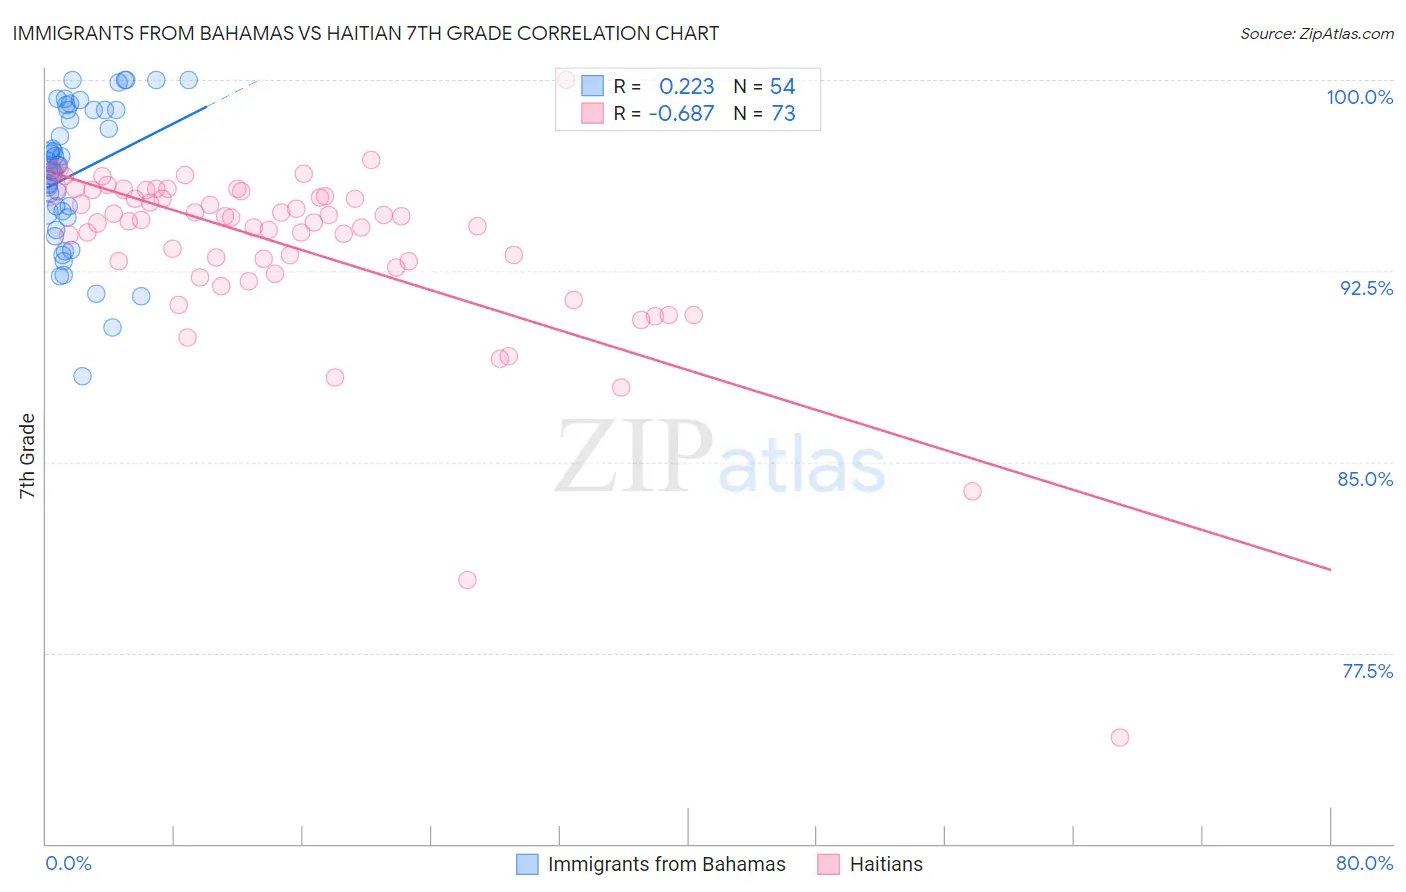
Immigrants from Bahamas vs Haitian 7th Grade Correlation Chart
The statistical analysis conducted on geographies consisting of 104,666,801 people shows a weak positive correlation between the proportion of Immigrants from Bahamas and percentage of population with at least 7th grade education in the United States with a correlation coefficient (R) of 0.223 and weighted average of 95.9%. Similarly, the statistical analysis conducted on geographies consisting of 287,965,116 people shows a significant negative correlation between the proportion of Haitians and percentage of population with at least 7th grade education in the United States with a correlation coefficient (R) of -0.687 and weighted average of 94.7%, a difference of 1.3%.
7th Grade Correlation Summary
| Measurement | Immigrants from Bahamas | Haitian |
| Minimum | 88.3% | 74.2% |
| Maximum | 100.0% | 100.0% |
| Range | 11.7% | 25.8% |
| Mean | 96.3% | 93.4% |
| Median | 96.6% | 94.5% |
| Interquartile 25% (IQ1) | 94.8% | 92.5% |
| Interquartile 75% (IQ3) | 98.8% | 95.5% |
| Interquartile Range (IQR) | 4.0% | 3.0% |
| Standard Deviation (Sample) | 2.8% | 3.7% |
| Standard Deviation (Population) | 2.7% | 3.7% |
Similar Demographics by 7th Grade
Demographics Similar to Immigrants from Bahamas by 7th Grade
In terms of 7th grade, the demographic groups most similar to Immigrants from Bahamas are Immigrants from Micronesia (95.9%, a difference of 0.010%), Liberian (95.9%, a difference of 0.010%), Panamanian (95.9%, a difference of 0.010%), Immigrants from Nepal (95.9%, a difference of 0.010%), and Immigrants from Egypt (95.9%, a difference of 0.020%).
| Demographics | Rating | Rank | 7th Grade |
| Immigrants | Iraq | 36.1 /100 | #186 | Fair 96.0% |
| Immigrants | Uganda | 36.0 /100 | #187 | Fair 96.0% |
| Immigrants | Egypt | 34.3 /100 | #188 | Fair 95.9% |
| Immigrants | Venezuela | 33.9 /100 | #189 | Fair 95.9% |
| Immigrants | Micronesia | 32.6 /100 | #190 | Fair 95.9% |
| Liberians | 32.5 /100 | #191 | Fair 95.9% |
| Panamanians | 32.3 /100 | #192 | Fair 95.9% |
| Immigrants | Bahamas | 30.8 /100 | #193 | Fair 95.9% |
| Immigrants | Nepal | 30.0 /100 | #194 | Fair 95.9% |
| Sudanese | 28.1 /100 | #195 | Fair 95.9% |
| Apache | 27.6 /100 | #196 | Fair 95.9% |
| Immigrants | Zaire | 26.7 /100 | #197 | Fair 95.9% |
| Paraguayans | 24.8 /100 | #198 | Fair 95.9% |
| Guamanians/Chamorros | 23.5 /100 | #199 | Fair 95.9% |
| Argentineans | 23.2 /100 | #200 | Fair 95.9% |
Demographics Similar to Haitians by 7th Grade
In terms of 7th grade, the demographic groups most similar to Haitians are Yaqui (94.6%, a difference of 0.030%), Cuban (94.6%, a difference of 0.040%), Fijian (94.7%, a difference of 0.080%), Immigrants from West Indies (94.8%, a difference of 0.10%), and Immigrants from Grenada (94.8%, a difference of 0.12%).
| Demographics | Rating | Rank | 7th Grade |
| Immigrants | Peru | 0.0 /100 | #287 | Tragic 94.9% |
| British West Indians | 0.0 /100 | #288 | Tragic 94.8% |
| Taiwanese | 0.0 /100 | #289 | Tragic 94.8% |
| Malaysians | 0.0 /100 | #290 | Tragic 94.8% |
| Immigrants | Grenada | 0.0 /100 | #291 | Tragic 94.8% |
| Immigrants | West Indies | 0.0 /100 | #292 | Tragic 94.8% |
| Fijians | 0.0 /100 | #293 | Tragic 94.7% |
| Haitians | 0.0 /100 | #294 | Tragic 94.7% |
| Yaqui | 0.0 /100 | #295 | Tragic 94.6% |
| Cubans | 0.0 /100 | #296 | Tragic 94.6% |
| Immigrants | South Eastern Asia | 0.0 /100 | #297 | Tragic 94.5% |
| Indonesians | 0.0 /100 | #298 | Tragic 94.5% |
| Bangladeshis | 0.0 /100 | #299 | Tragic 94.5% |
| Immigrants | Burma/Myanmar | 0.0 /100 | #300 | Tragic 94.5% |
| Immigrants | Dominica | 0.0 /100 | #301 | Tragic 94.5% |