Liberian vs Immigrants from Iran Doctorate Degree
COMPARE
Liberian
Immigrants from Iran
Doctorate Degree
Doctorate Degree Comparison
Liberians
Immigrants from Iran
1.5%
DOCTORATE DEGREE
0.9/ 100
METRIC RATING
259th/ 347
METRIC RANK
3.0%
DOCTORATE DEGREE
100.0/ 100
METRIC RATING
9th/ 347
METRIC RANK
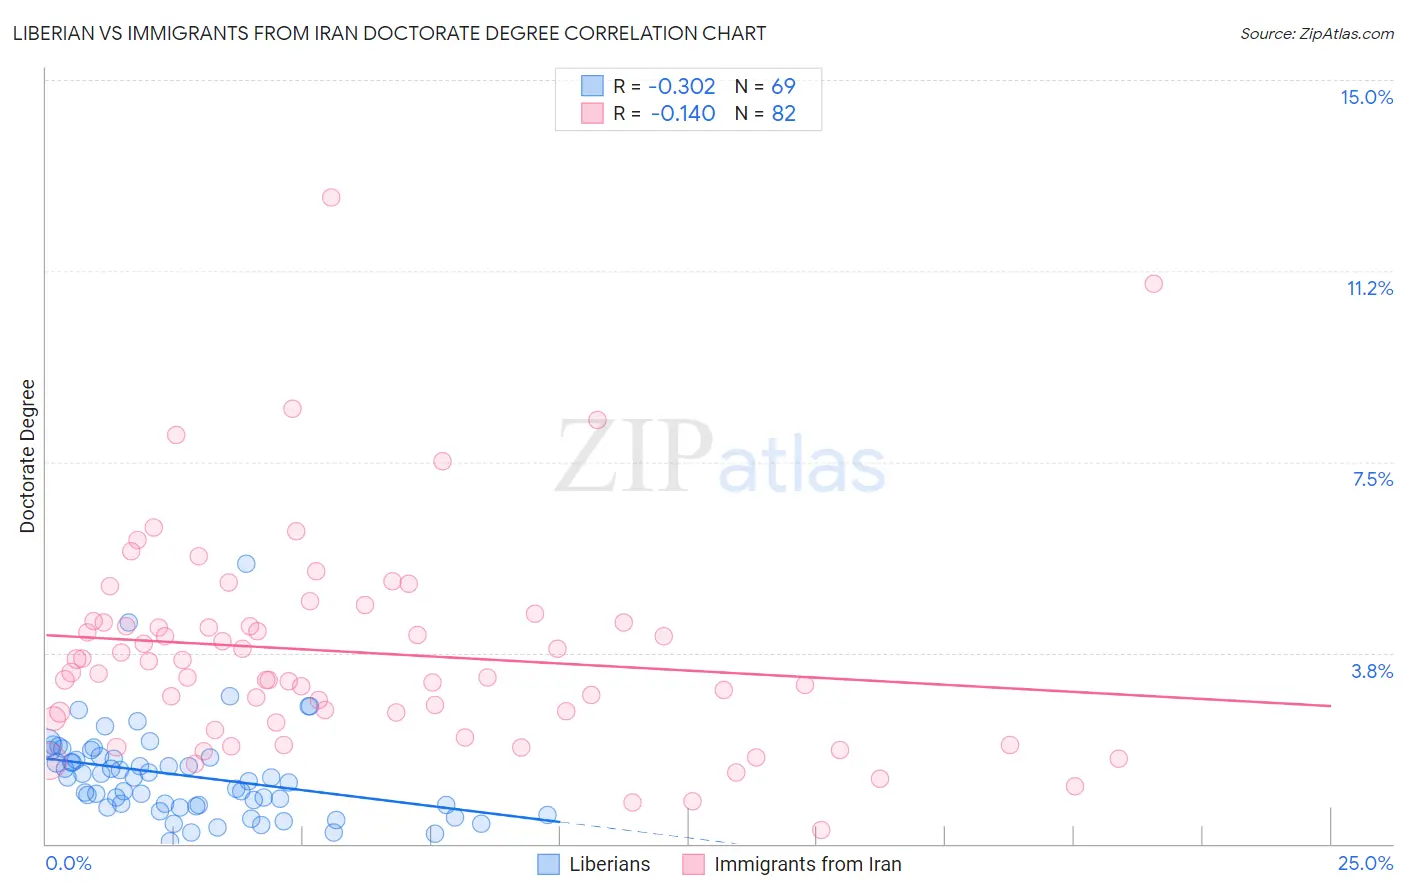
Liberian vs Immigrants from Iran Doctorate Degree Correlation Chart
The statistical analysis conducted on geographies consisting of 117,723,889 people shows a mild negative correlation between the proportion of Liberians and percentage of population with at least doctorate degree education in the United States with a correlation coefficient (R) of -0.302 and weighted average of 1.5%. Similarly, the statistical analysis conducted on geographies consisting of 279,321,520 people shows a poor negative correlation between the proportion of Immigrants from Iran and percentage of population with at least doctorate degree education in the United States with a correlation coefficient (R) of -0.140 and weighted average of 3.0%, a difference of 99.1%.
Doctorate Degree Correlation Summary
| Measurement | Liberian | Immigrants from Iran |
| Minimum | 0.049% | 0.26% |
| Maximum | 5.5% | 12.7% |
| Range | 5.4% | 12.4% |
| Mean | 1.3% | 3.8% |
| Median | 1.3% | 3.4% |
| Interquartile 25% (IQ1) | 0.74% | 2.5% |
| Interquartile 75% (IQ3) | 1.7% | 4.4% |
| Interquartile Range (IQR) | 0.96% | 1.9% |
| Standard Deviation (Sample) | 0.92% | 2.1% |
| Standard Deviation (Population) | 0.91% | 2.1% |
Similar Demographics by Doctorate Degree
Demographics Similar to Liberians by Doctorate Degree
In terms of doctorate degree, the demographic groups most similar to Liberians are Immigrants from West Indies (1.5%, a difference of 0.030%), Japanese (1.5%, a difference of 0.10%), Chippewa (1.5%, a difference of 0.28%), Central American Indian (1.5%, a difference of 0.51%), and Trinidadian and Tobagonian (1.5%, a difference of 0.55%).
| Demographics | Rating | Rank | Doctorate Degree |
| Yuman | 1.1 /100 | #252 | Tragic 1.5% |
| Americans | 1.0 /100 | #253 | Tragic 1.5% |
| Immigrants | Cambodia | 1.0 /100 | #254 | Tragic 1.5% |
| Trinidadians and Tobagonians | 1.0 /100 | #255 | Tragic 1.5% |
| Central American Indians | 1.0 /100 | #256 | Tragic 1.5% |
| Chippewa | 0.9 /100 | #257 | Tragic 1.5% |
| Immigrants | West Indies | 0.9 /100 | #258 | Tragic 1.5% |
| Liberians | 0.9 /100 | #259 | Tragic 1.5% |
| Japanese | 0.9 /100 | #260 | Tragic 1.5% |
| Immigrants | Portugal | 0.8 /100 | #261 | Tragic 1.5% |
| Chickasaw | 0.7 /100 | #262 | Tragic 1.5% |
| Immigrants | Bahamas | 0.7 /100 | #263 | Tragic 1.5% |
| Blackfeet | 0.7 /100 | #264 | Tragic 1.5% |
| Nicaraguans | 0.6 /100 | #265 | Tragic 1.5% |
| Immigrants | Liberia | 0.5 /100 | #266 | Tragic 1.5% |
Demographics Similar to Immigrants from Iran by Doctorate Degree
In terms of doctorate degree, the demographic groups most similar to Immigrants from Iran are Immigrants from Israel (3.0%, a difference of 0.67%), Immigrants from China (3.1%, a difference of 2.0%), Immigrants from Switzerland (3.1%, a difference of 2.1%), Immigrants from Eastern Asia (3.0%, a difference of 2.1%), and Iranian (3.1%, a difference of 4.0%).
| Demographics | Rating | Rank | Doctorate Degree |
| Filipinos | 100.0 /100 | #2 | Exceptional 3.4% |
| Okinawans | 100.0 /100 | #3 | Exceptional 3.3% |
| Immigrants | Taiwan | 100.0 /100 | #4 | Exceptional 3.2% |
| Iranians | 100.0 /100 | #5 | Exceptional 3.1% |
| Immigrants | Switzerland | 100.0 /100 | #6 | Exceptional 3.1% |
| Immigrants | China | 100.0 /100 | #7 | Exceptional 3.1% |
| Immigrants | Israel | 100.0 /100 | #8 | Exceptional 3.0% |
| Immigrants | Iran | 100.0 /100 | #9 | Exceptional 3.0% |
| Immigrants | Eastern Asia | 100.0 /100 | #10 | Exceptional 3.0% |
| Indians (Asian) | 100.0 /100 | #11 | Exceptional 2.9% |
| Immigrants | Belgium | 100.0 /100 | #12 | Exceptional 2.9% |
| Immigrants | Sweden | 100.0 /100 | #13 | Exceptional 2.9% |
| Immigrants | France | 100.0 /100 | #14 | Exceptional 2.9% |
| Immigrants | India | 100.0 /100 | #15 | Exceptional 2.8% |
| Eastern Europeans | 100.0 /100 | #16 | Exceptional 2.8% |