Irish vs Immigrants from Belarus Bachelor's Degree
COMPARE
Irish
Immigrants from Belarus
Bachelor's Degree
Bachelor's Degree Comparison
Irish
Immigrants from Belarus
37.6%
BACHELOR'S DEGREE
44.3/ 100
METRIC RATING
180th/ 347
METRIC RANK
45.0%
BACHELOR'S DEGREE
100.0/ 100
METRIC RATING
40th/ 347
METRIC RANK
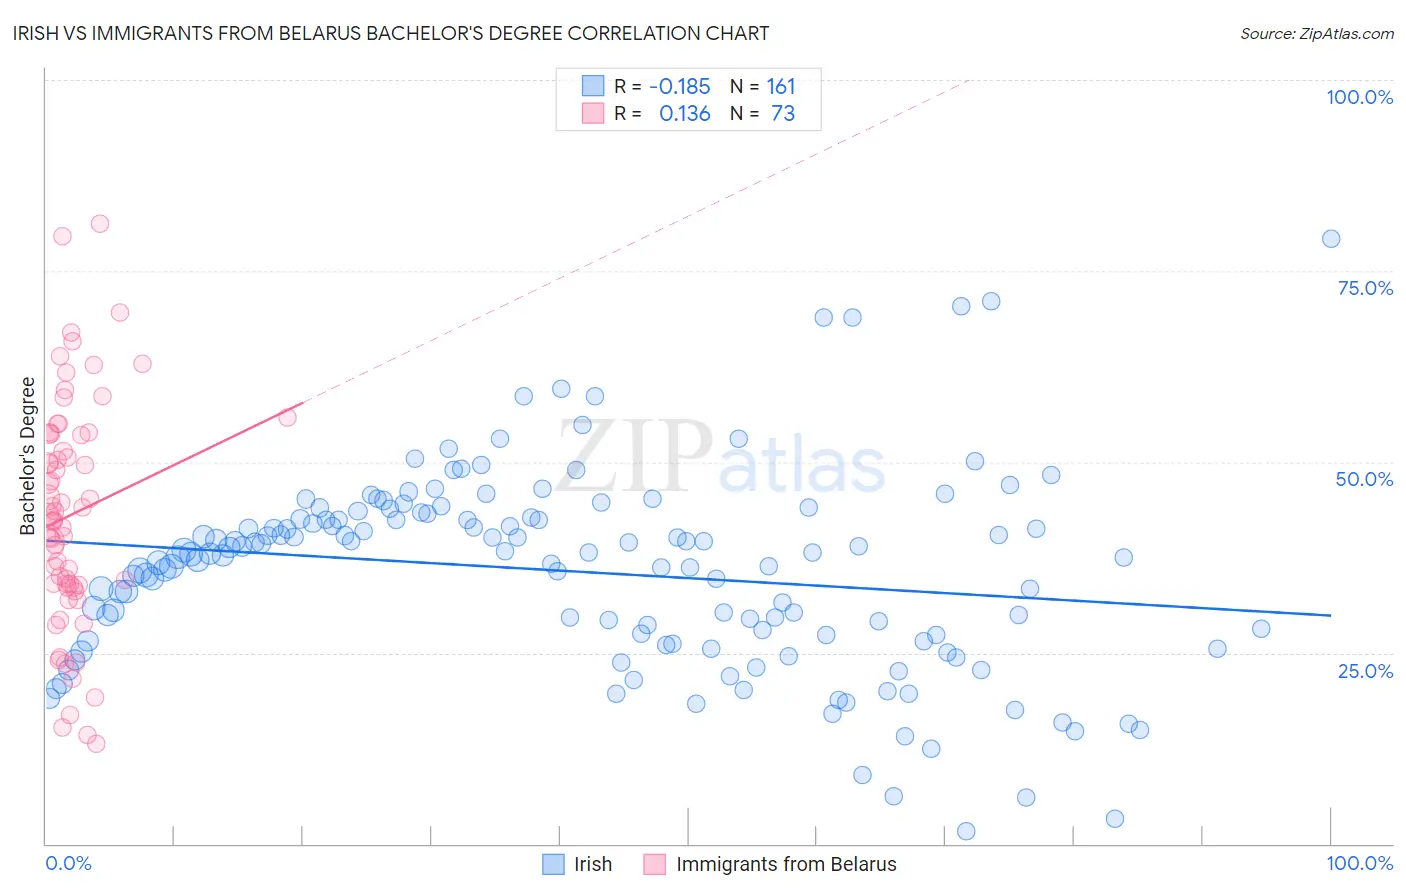
Irish vs Immigrants from Belarus Bachelor's Degree Correlation Chart
The statistical analysis conducted on geographies consisting of 580,386,909 people shows a poor negative correlation between the proportion of Irish and percentage of population with at least bachelor's degree education in the United States with a correlation coefficient (R) of -0.185 and weighted average of 37.6%. Similarly, the statistical analysis conducted on geographies consisting of 150,192,988 people shows a poor positive correlation between the proportion of Immigrants from Belarus and percentage of population with at least bachelor's degree education in the United States with a correlation coefficient (R) of 0.136 and weighted average of 45.0%, a difference of 19.7%.
Bachelor's Degree Correlation Summary
| Measurement | Irish | Immigrants from Belarus |
| Minimum | 1.6% | 13.1% |
| Maximum | 79.2% | 81.2% |
| Range | 77.6% | 68.1% |
| Mean | 35.7% | 43.1% |
| Median | 37.9% | 42.3% |
| Interquartile 25% (IQ1) | 26.6% | 33.8% |
| Interquartile 75% (IQ3) | 42.6% | 53.7% |
| Interquartile Range (IQR) | 16.1% | 19.9% |
| Standard Deviation (Sample) | 13.0% | 14.8% |
| Standard Deviation (Population) | 13.0% | 14.7% |
Similar Demographics by Bachelor's Degree
Demographics Similar to Irish by Bachelor's Degree
In terms of bachelor's degree, the demographic groups most similar to Irish are Immigrants from Senegal (37.6%, a difference of 0.050%), Immigrants from Bosnia and Herzegovina (37.6%, a difference of 0.090%), Immigrants from Colombia (37.7%, a difference of 0.11%), Senegalese (37.5%, a difference of 0.21%), and Immigrants from Cameroon (37.7%, a difference of 0.24%).
| Demographics | Rating | Rank | Bachelor's Degree |
| Immigrants | Iraq | 52.5 /100 | #173 | Average 37.9% |
| Immigrants | Bangladesh | 50.0 /100 | #174 | Average 37.8% |
| Immigrants | Uruguay | 48.3 /100 | #175 | Average 37.8% |
| Costa Ricans | 47.6 /100 | #176 | Average 37.7% |
| Basques | 47.4 /100 | #177 | Average 37.7% |
| Immigrants | Cameroon | 46.8 /100 | #178 | Average 37.7% |
| Immigrants | Colombia | 45.4 /100 | #179 | Average 37.7% |
| Irish | 44.3 /100 | #180 | Average 37.6% |
| Immigrants | Senegal | 43.8 /100 | #181 | Average 37.6% |
| Immigrants | Bosnia and Herzegovina | 43.4 /100 | #182 | Average 37.6% |
| Senegalese | 42.2 /100 | #183 | Average 37.5% |
| Scandinavians | 41.7 /100 | #184 | Average 37.5% |
| Immigrants | Peru | 41.3 /100 | #185 | Average 37.5% |
| Norwegians | 40.4 /100 | #186 | Average 37.5% |
| English | 39.7 /100 | #187 | Fair 37.4% |
Demographics Similar to Immigrants from Belarus by Bachelor's Degree
In terms of bachelor's degree, the demographic groups most similar to Immigrants from Belarus are Immigrants from Malaysia (45.0%, a difference of 0.040%), Immigrants from Latvia (45.1%, a difference of 0.27%), Immigrants from Saudi Arabia (44.8%, a difference of 0.42%), Immigrants from South Africa (44.8%, a difference of 0.56%), and Bulgarian (45.3%, a difference of 0.60%).
| Demographics | Rating | Rank | Bachelor's Degree |
| Immigrants | Northern Europe | 100.0 /100 | #33 | Exceptional 45.6% |
| Immigrants | Denmark | 100.0 /100 | #34 | Exceptional 45.4% |
| Immigrants | Russia | 100.0 /100 | #35 | Exceptional 45.4% |
| Mongolians | 100.0 /100 | #36 | Exceptional 45.4% |
| Russians | 100.0 /100 | #37 | Exceptional 45.3% |
| Bulgarians | 100.0 /100 | #38 | Exceptional 45.3% |
| Immigrants | Latvia | 100.0 /100 | #39 | Exceptional 45.1% |
| Immigrants | Belarus | 100.0 /100 | #40 | Exceptional 45.0% |
| Immigrants | Malaysia | 100.0 /100 | #41 | Exceptional 45.0% |
| Immigrants | Saudi Arabia | 100.0 /100 | #42 | Exceptional 44.8% |
| Immigrants | South Africa | 99.9 /100 | #43 | Exceptional 44.8% |
| Immigrants | Lithuania | 99.9 /100 | #44 | Exceptional 44.6% |
| Immigrants | Kuwait | 99.9 /100 | #45 | Exceptional 44.6% |
| Immigrants | Bulgaria | 99.9 /100 | #46 | Exceptional 44.6% |
| Bolivians | 99.9 /100 | #47 | Exceptional 44.6% |