Liberian vs Immigrants from Eastern Europe 3rd Grade
COMPARE
Liberian
Immigrants from Eastern Europe
3rd Grade
3rd Grade Comparison
Liberians
Immigrants from Eastern Europe
97.4%
3RD GRADE
1.8/ 100
METRIC RATING
236th/ 347
METRIC RANK
97.8%
3RD GRADE
64.1/ 100
METRIC RATING
154th/ 347
METRIC RANK
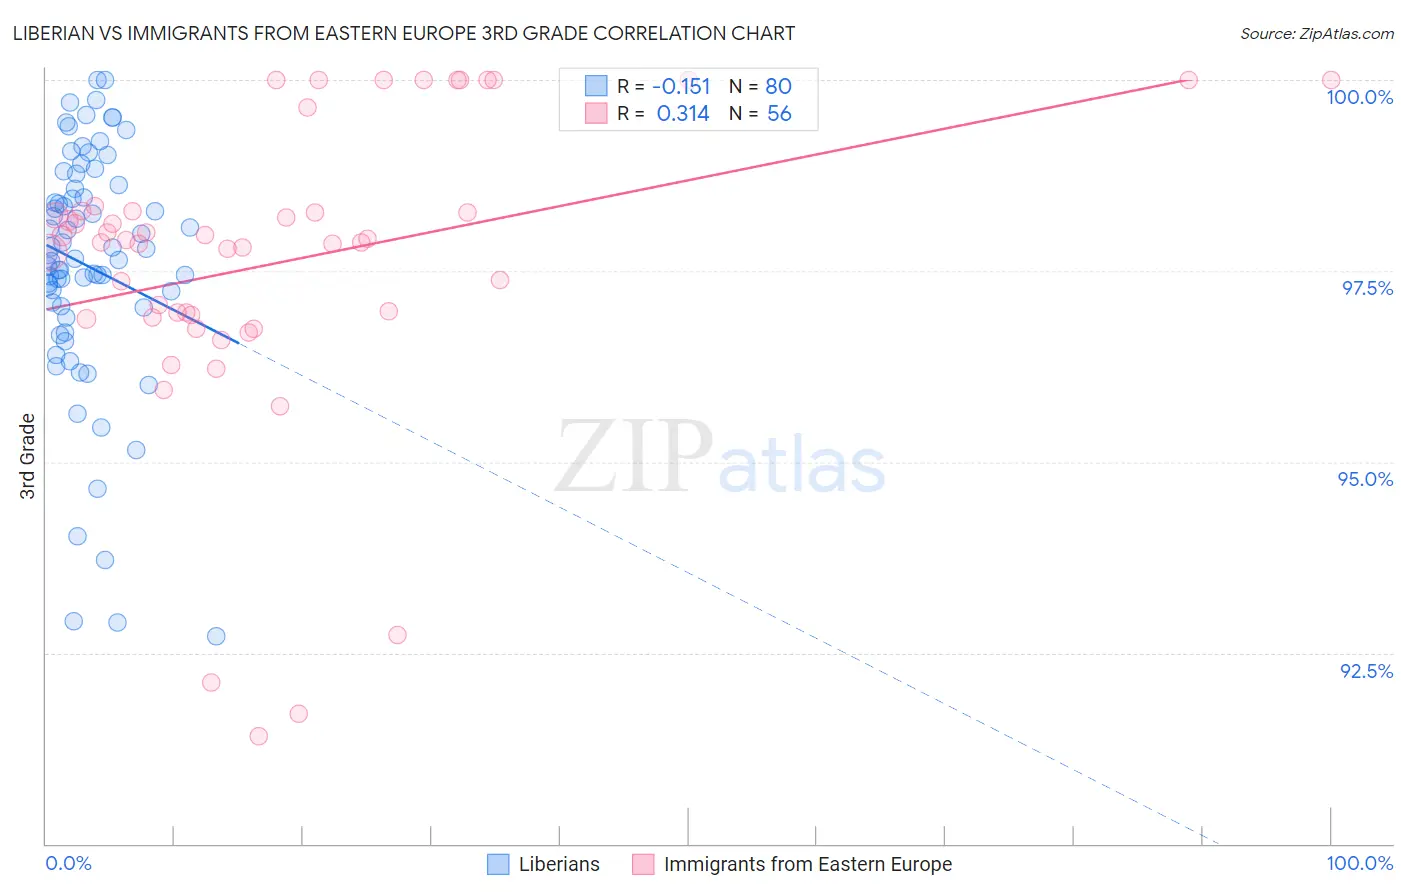
Liberian vs Immigrants from Eastern Europe 3rd Grade Correlation Chart
The statistical analysis conducted on geographies consisting of 118,103,458 people shows a poor negative correlation between the proportion of Liberians and percentage of population with at least 3rd grade education in the United States with a correlation coefficient (R) of -0.151 and weighted average of 97.4%. Similarly, the statistical analysis conducted on geographies consisting of 475,879,420 people shows a mild positive correlation between the proportion of Immigrants from Eastern Europe and percentage of population with at least 3rd grade education in the United States with a correlation coefficient (R) of 0.314 and weighted average of 97.8%, a difference of 0.39%.
3rd Grade Correlation Summary
| Measurement | Liberian | Immigrants from Eastern Europe |
| Minimum | 92.7% | 91.4% |
| Maximum | 100.0% | 100.0% |
| Range | 7.3% | 8.6% |
| Mean | 97.6% | 97.6% |
| Median | 97.7% | 97.9% |
| Interquartile 25% (IQ1) | 97.0% | 96.9% |
| Interquartile 75% (IQ3) | 98.6% | 98.3% |
| Interquartile Range (IQR) | 1.6% | 1.4% |
| Standard Deviation (Sample) | 1.6% | 2.0% |
| Standard Deviation (Population) | 1.6% | 2.0% |
Similar Demographics by 3rd Grade
Demographics Similar to Liberians by 3rd Grade
In terms of 3rd grade, the demographic groups most similar to Liberians are Immigrants from Iraq (97.4%, a difference of 0.0%), Colombian (97.4%, a difference of 0.0%), Immigrants from Eastern Asia (97.4%, a difference of 0.010%), Immigrants from Uruguay (97.4%, a difference of 0.010%), and Nigerian (97.4%, a difference of 0.010%).
| Demographics | Rating | Rank | 3rd Grade |
| Senegalese | 3.0 /100 | #229 | Tragic 97.5% |
| Immigrants | Pakistan | 2.7 /100 | #230 | Tragic 97.5% |
| Immigrants | Costa Rica | 2.7 /100 | #231 | Tragic 97.5% |
| Immigrants | Western Asia | 2.6 /100 | #232 | Tragic 97.5% |
| Immigrants | Malaysia | 2.4 /100 | #233 | Tragic 97.5% |
| Immigrants | Eastern Asia | 1.9 /100 | #234 | Tragic 97.4% |
| Immigrants | Iraq | 1.8 /100 | #235 | Tragic 97.4% |
| Liberians | 1.8 /100 | #236 | Tragic 97.4% |
| Colombians | 1.8 /100 | #237 | Tragic 97.4% |
| Immigrants | Uruguay | 1.7 /100 | #238 | Tragic 97.4% |
| Nigerians | 1.6 /100 | #239 | Tragic 97.4% |
| U.S. Virgin Islanders | 1.4 /100 | #240 | Tragic 97.4% |
| Immigrants | Indonesia | 1.4 /100 | #241 | Tragic 97.4% |
| Koreans | 1.3 /100 | #242 | Tragic 97.4% |
| Indians (Asian) | 1.3 /100 | #243 | Tragic 97.4% |
Demographics Similar to Immigrants from Eastern Europe by 3rd Grade
In terms of 3rd grade, the demographic groups most similar to Immigrants from Eastern Europe are Bermudan (97.8%, a difference of 0.010%), Immigrants from Russia (97.8%, a difference of 0.010%), Immigrants from Italy (97.8%, a difference of 0.010%), Venezuelan (97.8%, a difference of 0.010%), and French American Indian (97.8%, a difference of 0.010%).
| Demographics | Rating | Rank | 3rd Grade |
| Immigrants | Israel | 77.3 /100 | #147 | Good 97.9% |
| Immigrants | Moldova | 77.1 /100 | #148 | Good 97.9% |
| Immigrants | North Macedonia | 74.5 /100 | #149 | Good 97.8% |
| Jordanians | 74.5 /100 | #150 | Good 97.8% |
| Soviet Union | 72.6 /100 | #151 | Good 97.8% |
| Immigrants | South Central Asia | 69.5 /100 | #152 | Good 97.8% |
| Apache | 68.5 /100 | #153 | Good 97.8% |
| Immigrants | Eastern Europe | 64.1 /100 | #154 | Good 97.8% |
| Bermudans | 62.6 /100 | #155 | Good 97.8% |
| Immigrants | Russia | 61.7 /100 | #156 | Good 97.8% |
| Immigrants | Italy | 61.2 /100 | #157 | Good 97.8% |
| Venezuelans | 60.9 /100 | #158 | Good 97.8% |
| French American Indians | 60.0 /100 | #159 | Average 97.8% |
| Immigrants | Iran | 59.1 /100 | #160 | Average 97.8% |
| Albanians | 58.8 /100 | #161 | Average 97.8% |