Vietnamese vs Central American 3rd Grade
COMPARE
Vietnamese
Central American
3rd Grade
3rd Grade Comparison
Vietnamese
Central Americans
96.5%
3RD GRADE
0.0/ 100
METRIC RATING
319th/ 347
METRIC RANK
96.1%
3RD GRADE
0.0/ 100
METRIC RATING
337th/ 347
METRIC RANK
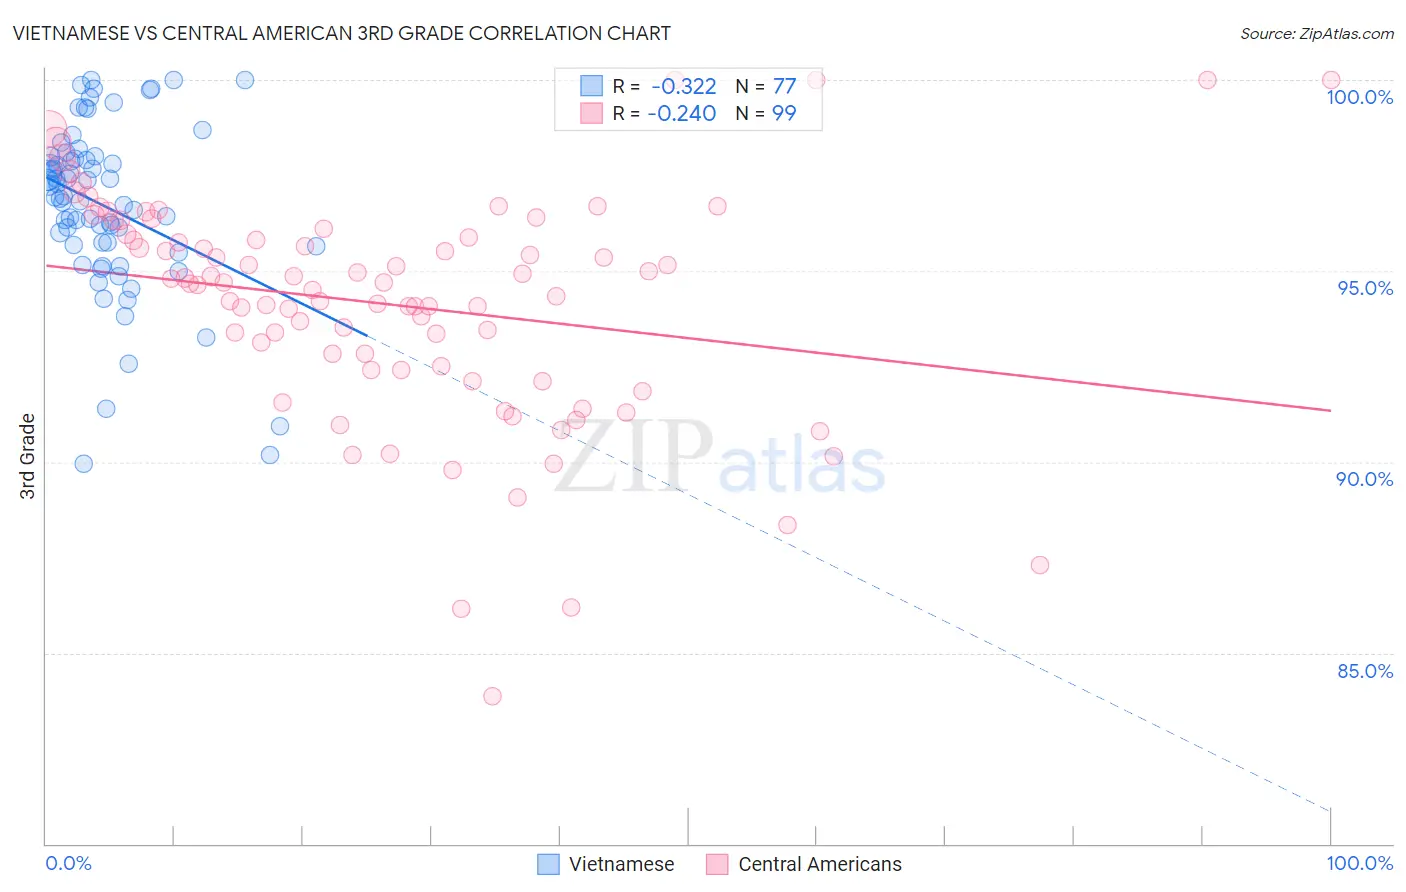
Vietnamese vs Central American 3rd Grade Correlation Chart
The statistical analysis conducted on geographies consisting of 170,752,104 people shows a mild negative correlation between the proportion of Vietnamese and percentage of population with at least 3rd grade education in the United States with a correlation coefficient (R) of -0.322 and weighted average of 96.5%. Similarly, the statistical analysis conducted on geographies consisting of 504,619,275 people shows a weak negative correlation between the proportion of Central Americans and percentage of population with at least 3rd grade education in the United States with a correlation coefficient (R) of -0.240 and weighted average of 96.1%, a difference of 0.45%.
3rd Grade Correlation Summary
| Measurement | Vietnamese | Central American |
| Minimum | 89.9% | 83.9% |
| Maximum | 100.0% | 100.0% |
| Range | 10.1% | 16.1% |
| Mean | 96.7% | 94.1% |
| Median | 96.9% | 94.7% |
| Interquartile 25% (IQ1) | 95.7% | 92.4% |
| Interquartile 75% (IQ3) | 98.0% | 96.0% |
| Interquartile Range (IQR) | 2.3% | 3.6% |
| Standard Deviation (Sample) | 2.2% | 3.0% |
| Standard Deviation (Population) | 2.2% | 3.0% |
Demographics Similar to Vietnamese and Central Americans by 3rd Grade
In terms of 3rd grade, the demographic groups most similar to Vietnamese are Hispanic or Latino (96.5%, a difference of 0.010%), Immigrants from Nicaragua (96.5%, a difference of 0.010%), Indonesian (96.5%, a difference of 0.010%), Immigrants from Belize (96.5%, a difference of 0.020%), and Honduran (96.5%, a difference of 0.040%). Similarly, the demographic groups most similar to Central Americans are Immigrants from Cabo Verde (96.2%, a difference of 0.080%), Immigrants from Cambodia (96.2%, a difference of 0.10%), Immigrants from Dominican Republic (96.2%, a difference of 0.10%), Immigrants from Fiji (96.2%, a difference of 0.12%), and Guatemalan (96.0%, a difference of 0.12%).
| Demographics | Rating | Rank | 3rd Grade |
| Hispanics or Latinos | 0.0 /100 | #318 | Tragic 96.5% |
| Vietnamese | 0.0 /100 | #319 | Tragic 96.5% |
| Immigrants | Nicaragua | 0.0 /100 | #320 | Tragic 96.5% |
| Indonesians | 0.0 /100 | #321 | Tragic 96.5% |
| Immigrants | Belize | 0.0 /100 | #322 | Tragic 96.5% |
| Hondurans | 0.0 /100 | #323 | Tragic 96.5% |
| Dominicans | 0.0 /100 | #324 | Tragic 96.4% |
| Mexican American Indians | 0.0 /100 | #325 | Tragic 96.4% |
| Immigrants | Vietnam | 0.0 /100 | #326 | Tragic 96.4% |
| Japanese | 0.0 /100 | #327 | Tragic 96.4% |
| Bangladeshis | 0.0 /100 | #328 | Tragic 96.3% |
| Immigrants | Honduras | 0.0 /100 | #329 | Tragic 96.3% |
| Immigrants | Armenia | 0.0 /100 | #330 | Tragic 96.3% |
| Immigrants | Latin America | 0.0 /100 | #331 | Tragic 96.2% |
| Mexicans | 0.0 /100 | #332 | Tragic 96.2% |
| Immigrants | Fiji | 0.0 /100 | #333 | Tragic 96.2% |
| Immigrants | Cambodia | 0.0 /100 | #334 | Tragic 96.2% |
| Immigrants | Dominican Republic | 0.0 /100 | #335 | Tragic 96.2% |
| Immigrants | Cabo Verde | 0.0 /100 | #336 | Tragic 96.2% |
| Central Americans | 0.0 /100 | #337 | Tragic 96.1% |
| Guatemalans | 0.0 /100 | #338 | Tragic 96.0% |