Liberian vs Argentinean 3rd Grade
COMPARE
Liberian
Argentinean
3rd Grade
3rd Grade Comparison
Liberians
Argentineans
97.4%
3RD GRADE
1.8/ 100
METRIC RATING
236th/ 347
METRIC RANK
97.7%
3RD GRADE
42.9/ 100
METRIC RATING
182nd/ 347
METRIC RANK
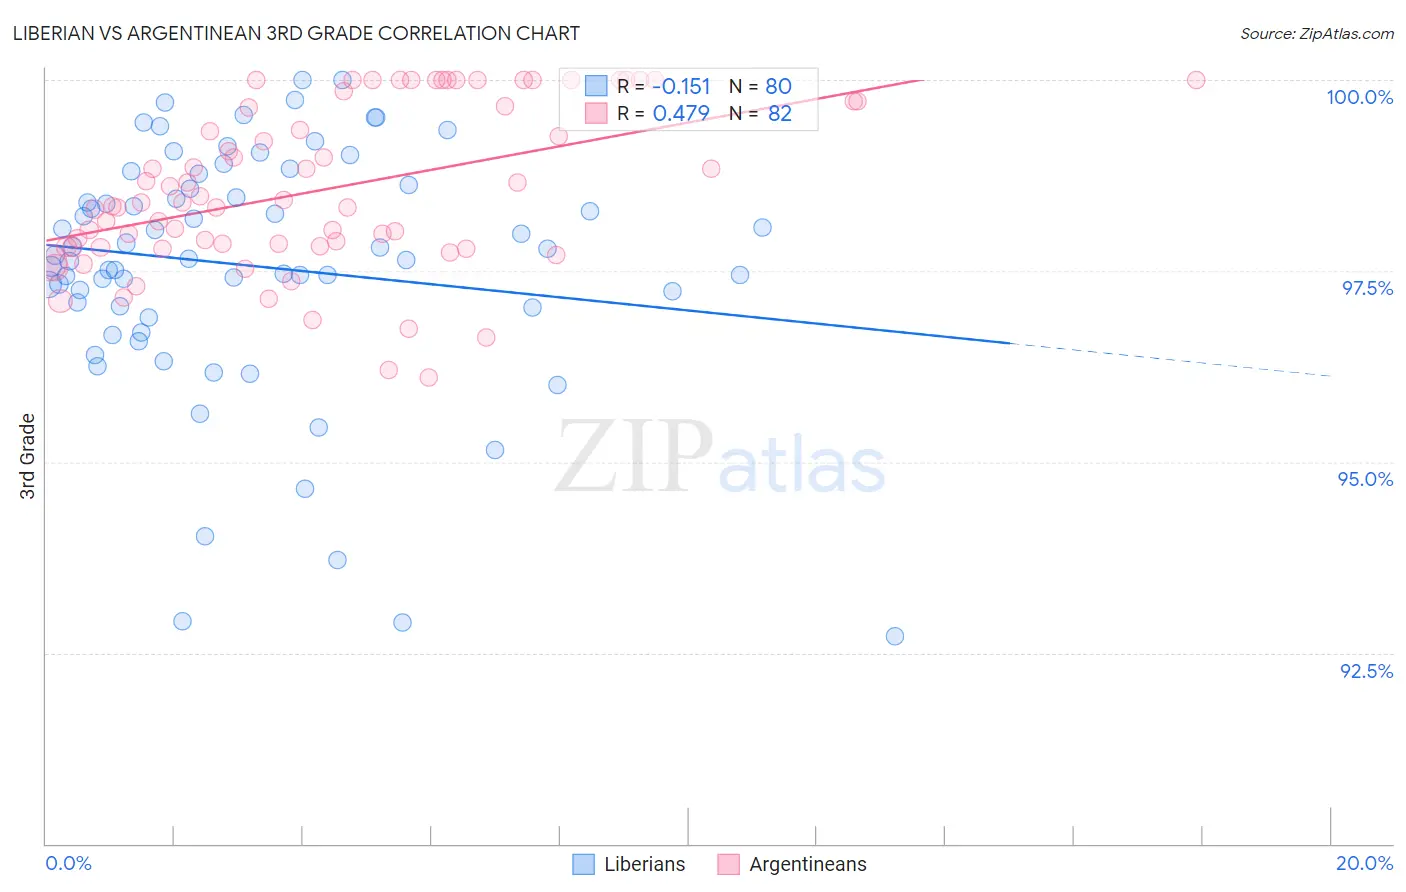
Liberian vs Argentinean 3rd Grade Correlation Chart
The statistical analysis conducted on geographies consisting of 118,103,458 people shows a poor negative correlation between the proportion of Liberians and percentage of population with at least 3rd grade education in the United States with a correlation coefficient (R) of -0.151 and weighted average of 97.4%. Similarly, the statistical analysis conducted on geographies consisting of 297,146,811 people shows a moderate positive correlation between the proportion of Argentineans and percentage of population with at least 3rd grade education in the United States with a correlation coefficient (R) of 0.479 and weighted average of 97.7%, a difference of 0.32%.
3rd Grade Correlation Summary
| Measurement | Liberian | Argentinean |
| Minimum | 92.7% | 96.1% |
| Maximum | 100.0% | 100.0% |
| Range | 7.3% | 3.9% |
| Mean | 97.6% | 98.6% |
| Median | 97.7% | 98.4% |
| Interquartile 25% (IQ1) | 97.0% | 97.8% |
| Interquartile 75% (IQ3) | 98.6% | 99.7% |
| Interquartile Range (IQR) | 1.6% | 1.9% |
| Standard Deviation (Sample) | 1.6% | 1.1% |
| Standard Deviation (Population) | 1.6% | 1.1% |
Similar Demographics by 3rd Grade
Demographics Similar to Liberians by 3rd Grade
In terms of 3rd grade, the demographic groups most similar to Liberians are Immigrants from Iraq (97.4%, a difference of 0.0%), Colombian (97.4%, a difference of 0.0%), Immigrants from Eastern Asia (97.4%, a difference of 0.010%), Immigrants from Uruguay (97.4%, a difference of 0.010%), and Nigerian (97.4%, a difference of 0.010%).
| Demographics | Rating | Rank | 3rd Grade |
| Senegalese | 3.0 /100 | #229 | Tragic 97.5% |
| Immigrants | Pakistan | 2.7 /100 | #230 | Tragic 97.5% |
| Immigrants | Costa Rica | 2.7 /100 | #231 | Tragic 97.5% |
| Immigrants | Western Asia | 2.6 /100 | #232 | Tragic 97.5% |
| Immigrants | Malaysia | 2.4 /100 | #233 | Tragic 97.5% |
| Immigrants | Eastern Asia | 1.9 /100 | #234 | Tragic 97.4% |
| Immigrants | Iraq | 1.8 /100 | #235 | Tragic 97.4% |
| Liberians | 1.8 /100 | #236 | Tragic 97.4% |
| Colombians | 1.8 /100 | #237 | Tragic 97.4% |
| Immigrants | Uruguay | 1.7 /100 | #238 | Tragic 97.4% |
| Nigerians | 1.6 /100 | #239 | Tragic 97.4% |
| U.S. Virgin Islanders | 1.4 /100 | #240 | Tragic 97.4% |
| Immigrants | Indonesia | 1.4 /100 | #241 | Tragic 97.4% |
| Koreans | 1.3 /100 | #242 | Tragic 97.4% |
| Indians (Asian) | 1.3 /100 | #243 | Tragic 97.4% |
Demographics Similar to Argentineans by 3rd Grade
In terms of 3rd grade, the demographic groups most similar to Argentineans are Immigrants from Poland (97.8%, a difference of 0.010%), Egyptian (97.7%, a difference of 0.010%), Immigrants from Brazil (97.7%, a difference of 0.010%), Immigrants from Belarus (97.7%, a difference of 0.010%), and Immigrants from Sri Lanka (97.7%, a difference of 0.010%).
| Demographics | Rating | Rank | 3rd Grade |
| Immigrants | Micronesia | 47.6 /100 | #175 | Average 97.8% |
| Immigrants | Poland | 47.1 /100 | #176 | Average 97.8% |
| Egyptians | 46.6 /100 | #177 | Average 97.7% |
| Immigrants | Brazil | 46.4 /100 | #178 | Average 97.7% |
| Immigrants | Belarus | 45.9 /100 | #179 | Average 97.7% |
| Immigrants | Sri Lanka | 45.1 /100 | #180 | Average 97.7% |
| Immigrants | Venezuela | 44.4 /100 | #181 | Average 97.7% |
| Argentineans | 42.9 /100 | #182 | Average 97.7% |
| Arabs | 40.0 /100 | #183 | Fair 97.7% |
| Immigrants | Kazakhstan | 37.4 /100 | #184 | Fair 97.7% |
| Immigrants | Argentina | 37.0 /100 | #185 | Fair 97.7% |
| Portuguese | 36.2 /100 | #186 | Fair 97.7% |
| Natives/Alaskans | 35.2 /100 | #187 | Fair 97.7% |
| Immigrants | Taiwan | 34.2 /100 | #188 | Fair 97.7% |
| Pakistanis | 34.2 /100 | #189 | Fair 97.7% |