Immigrants from North Macedonia vs Osage College, Under 1 year
COMPARE
Immigrants from North Macedonia
Osage
College, Under 1 year
College, Under 1 year Comparison
Immigrants from North Macedonia
Osage
65.4%
COLLEGE, UNDER 1 YEAR
48.6/ 100
METRIC RATING
177th/ 347
METRIC RANK
62.7%
COLLEGE, UNDER 1 YEAR
2.2/ 100
METRIC RATING
232nd/ 347
METRIC RANK
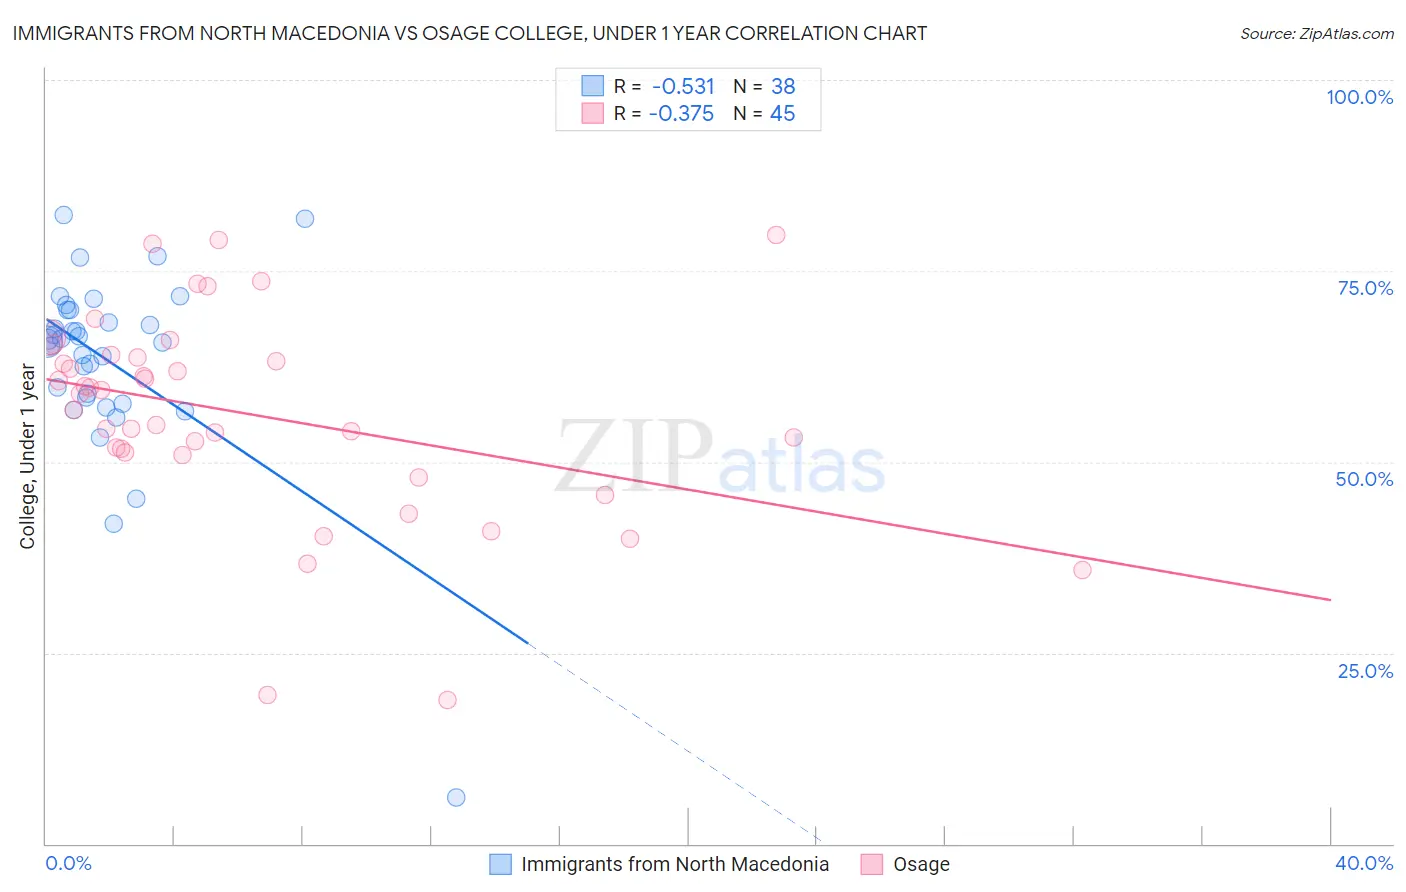
Immigrants from North Macedonia vs Osage College, Under 1 year Correlation Chart
The statistical analysis conducted on geographies consisting of 74,317,186 people shows a substantial negative correlation between the proportion of Immigrants from North Macedonia and percentage of population with at least college, under 1 year education in the United States with a correlation coefficient (R) of -0.531 and weighted average of 65.4%. Similarly, the statistical analysis conducted on geographies consisting of 91,808,929 people shows a mild negative correlation between the proportion of Osage and percentage of population with at least college, under 1 year education in the United States with a correlation coefficient (R) of -0.375 and weighted average of 62.7%, a difference of 4.3%.
College, Under 1 year Correlation Summary
| Measurement | Immigrants from North Macedonia | Osage |
| Minimum | 6.0% | 18.8% |
| Maximum | 82.4% | 79.7% |
| Range | 76.3% | 60.9% |
| Mean | 63.2% | 56.2% |
| Median | 65.9% | 58.9% |
| Interquartile 25% (IQ1) | 58.4% | 51.1% |
| Interquartile 75% (IQ3) | 69.8% | 63.8% |
| Interquartile Range (IQR) | 11.5% | 12.7% |
| Standard Deviation (Sample) | 12.7% | 13.5% |
| Standard Deviation (Population) | 12.6% | 13.4% |
Similar Demographics by College, Under 1 year
Demographics Similar to Immigrants from North Macedonia by College, Under 1 year
In terms of college, under 1 year, the demographic groups most similar to Immigrants from North Macedonia are French (65.4%, a difference of 0.010%), German Russian (65.4%, a difference of 0.010%), Guamanian/Chamorro (65.4%, a difference of 0.020%), Scotch-Irish (65.4%, a difference of 0.040%), and Immigrants from Bosnia and Herzegovina (65.4%, a difference of 0.060%).
| Demographics | Rating | Rank | College, Under 1 year |
| Germans | 55.7 /100 | #170 | Average 65.6% |
| Immigrants | Oceania | 55.0 /100 | #171 | Average 65.6% |
| South American Indians | 54.4 /100 | #172 | Average 65.5% |
| Swiss | 53.9 /100 | #173 | Average 65.5% |
| Immigrants | Bosnia and Herzegovina | 50.0 /100 | #174 | Average 65.4% |
| Scotch-Irish | 49.5 /100 | #175 | Average 65.4% |
| French | 48.9 /100 | #176 | Average 65.4% |
| Immigrants | North Macedonia | 48.6 /100 | #177 | Average 65.4% |
| German Russians | 48.3 /100 | #178 | Average 65.4% |
| Guamanians/Chamorros | 48.2 /100 | #179 | Average 65.4% |
| Dutch | 46.1 /100 | #180 | Average 65.3% |
| Spaniards | 45.5 /100 | #181 | Average 65.3% |
| Immigrants | Africa | 44.7 /100 | #182 | Average 65.3% |
| Immigrants | Poland | 42.6 /100 | #183 | Average 65.2% |
| Bermudans | 42.0 /100 | #184 | Average 65.2% |
Demographics Similar to Osage by College, Under 1 year
In terms of college, under 1 year, the demographic groups most similar to Osage are Immigrants from Western Africa (62.8%, a difference of 0.11%), Iroquois (62.6%, a difference of 0.12%), Chippewa (62.6%, a difference of 0.15%), Spanish American (62.6%, a difference of 0.20%), and Immigrants (62.5%, a difference of 0.33%).
| Demographics | Rating | Rank | College, Under 1 year |
| Immigrants | Peru | 4.0 /100 | #225 | Tragic 63.1% |
| Immigrants | Colombia | 4.0 /100 | #226 | Tragic 63.1% |
| Immigrants | Ghana | 3.7 /100 | #227 | Tragic 63.1% |
| Samoans | 3.3 /100 | #228 | Tragic 63.0% |
| Liberians | 3.2 /100 | #229 | Tragic 63.0% |
| Immigrants | Nonimmigrants | 3.0 /100 | #230 | Tragic 62.9% |
| Immigrants | Western Africa | 2.4 /100 | #231 | Tragic 62.8% |
| Osage | 2.2 /100 | #232 | Tragic 62.7% |
| Iroquois | 2.0 /100 | #233 | Tragic 62.6% |
| Chippewa | 2.0 /100 | #234 | Tragic 62.6% |
| Spanish Americans | 1.9 /100 | #235 | Tragic 62.6% |
| Immigrants | Immigrants | 1.7 /100 | #236 | Tragic 62.5% |
| Immigrants | Burma/Myanmar | 1.6 /100 | #237 | Tragic 62.5% |
| French American Indians | 1.5 /100 | #238 | Tragic 62.4% |
| Nepalese | 1.1 /100 | #239 | Tragic 62.2% |