Latvian vs Turkish College, 1 year or more
COMPARE
Latvian
Turkish
College, 1 year or more
College, 1 year or more Comparison
Latvians
Turks
66.1%
COLLEGE, 1 YEAR OR MORE
100.0/ 100
METRIC RATING
26th/ 347
METRIC RANK
65.5%
COLLEGE, 1 YEAR OR MORE
100.0/ 100
METRIC RATING
31st/ 347
METRIC RANK
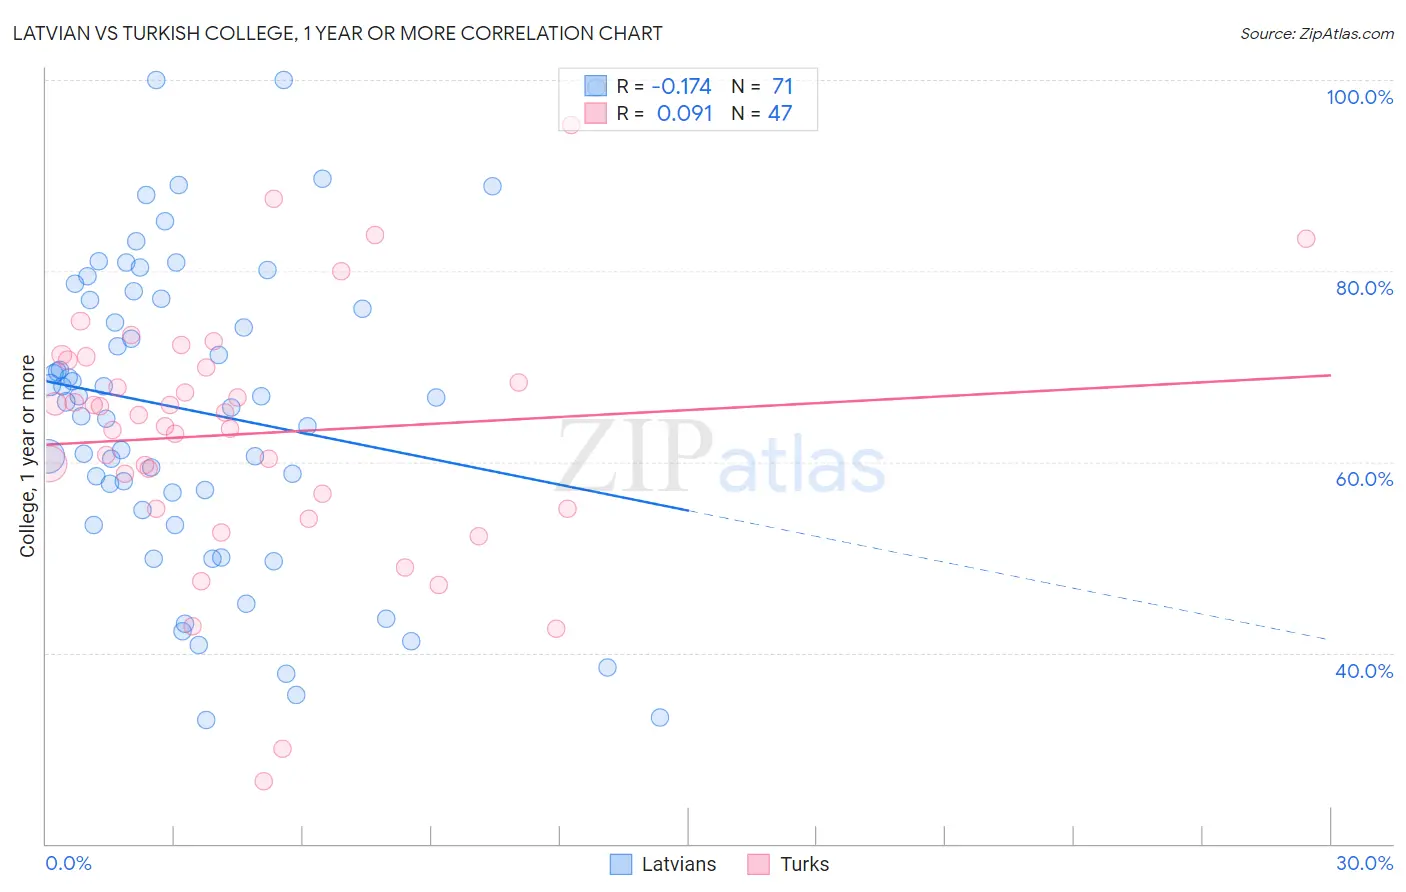
Latvian vs Turkish College, 1 year or more Correlation Chart
The statistical analysis conducted on geographies consisting of 220,726,880 people shows a poor negative correlation between the proportion of Latvians and percentage of population with at least college, 1 year or more education in the United States with a correlation coefficient (R) of -0.174 and weighted average of 66.1%. Similarly, the statistical analysis conducted on geographies consisting of 271,864,133 people shows a slight positive correlation between the proportion of Turks and percentage of population with at least college, 1 year or more education in the United States with a correlation coefficient (R) of 0.091 and weighted average of 65.5%, a difference of 0.81%.
College, 1 year or more Correlation Summary
| Measurement | Latvian | Turkish |
| Minimum | 32.9% | 26.5% |
| Maximum | 100.0% | 95.2% |
| Range | 67.1% | 68.7% |
| Mean | 65.3% | 63.0% |
| Median | 66.8% | 64.9% |
| Interquartile 25% (IQ1) | 54.9% | 55.1% |
| Interquartile 75% (IQ3) | 77.1% | 70.6% |
| Interquartile Range (IQR) | 22.1% | 15.5% |
| Standard Deviation (Sample) | 16.2% | 13.2% |
| Standard Deviation (Population) | 16.1% | 13.1% |
Demographics Similar to Latvians and Turks by College, 1 year or more
In terms of college, 1 year or more, the demographic groups most similar to Latvians are Indian (Asian) (66.1%, a difference of 0.040%), Immigrants from Ireland (65.9%, a difference of 0.20%), Immigrants from France (65.8%, a difference of 0.37%), Immigrants from Belgium (66.3%, a difference of 0.39%), and Immigrants from China (66.4%, a difference of 0.47%). Similarly, the demographic groups most similar to Turks are Bulgarian (65.5%, a difference of 0.050%), Immigrants from Denmark (65.6%, a difference of 0.080%), Immigrants from Northern Europe (65.6%, a difference of 0.19%), Immigrants from Sri Lanka (65.4%, a difference of 0.20%), and Israeli (65.3%, a difference of 0.32%).
| Demographics | Rating | Rank | College, 1 year or more |
| Eastern Europeans | 100.0 /100 | #18 | Exceptional 66.6% |
| Immigrants | Switzerland | 100.0 /100 | #19 | Exceptional 66.5% |
| Immigrants | Korea | 100.0 /100 | #20 | Exceptional 66.5% |
| Immigrants | Hong Kong | 100.0 /100 | #21 | Exceptional 66.4% |
| Soviet Union | 100.0 /100 | #22 | Exceptional 66.4% |
| Immigrants | China | 100.0 /100 | #23 | Exceptional 66.4% |
| Immigrants | Belgium | 100.0 /100 | #24 | Exceptional 66.3% |
| Indians (Asian) | 100.0 /100 | #25 | Exceptional 66.1% |
| Latvians | 100.0 /100 | #26 | Exceptional 66.1% |
| Immigrants | Ireland | 100.0 /100 | #27 | Exceptional 65.9% |
| Immigrants | France | 100.0 /100 | #28 | Exceptional 65.8% |
| Immigrants | Northern Europe | 100.0 /100 | #29 | Exceptional 65.6% |
| Immigrants | Denmark | 100.0 /100 | #30 | Exceptional 65.6% |
| Turks | 100.0 /100 | #31 | Exceptional 65.5% |
| Bulgarians | 100.0 /100 | #32 | Exceptional 65.5% |
| Immigrants | Sri Lanka | 99.9 /100 | #33 | Exceptional 65.4% |
| Israelis | 99.9 /100 | #34 | Exceptional 65.3% |
| Immigrants | Turkey | 99.9 /100 | #35 | Exceptional 65.2% |
| Immigrants | South Africa | 99.9 /100 | #36 | Exceptional 65.1% |
| Russians | 99.9 /100 | #37 | Exceptional 65.1% |
| Immigrants | Saudi Arabia | 99.9 /100 | #38 | Exceptional 65.0% |