Latvian vs Immigrants from Middle Africa College, 1 year or more
COMPARE
Latvian
Immigrants from Middle Africa
College, 1 year or more
College, 1 year or more Comparison
Latvians
Immigrants from Middle Africa
66.1%
COLLEGE, 1 YEAR OR MORE
100.0/ 100
METRIC RATING
26th/ 347
METRIC RANK
58.0%
COLLEGE, 1 YEAR OR MORE
14.0/ 100
METRIC RATING
209th/ 347
METRIC RANK
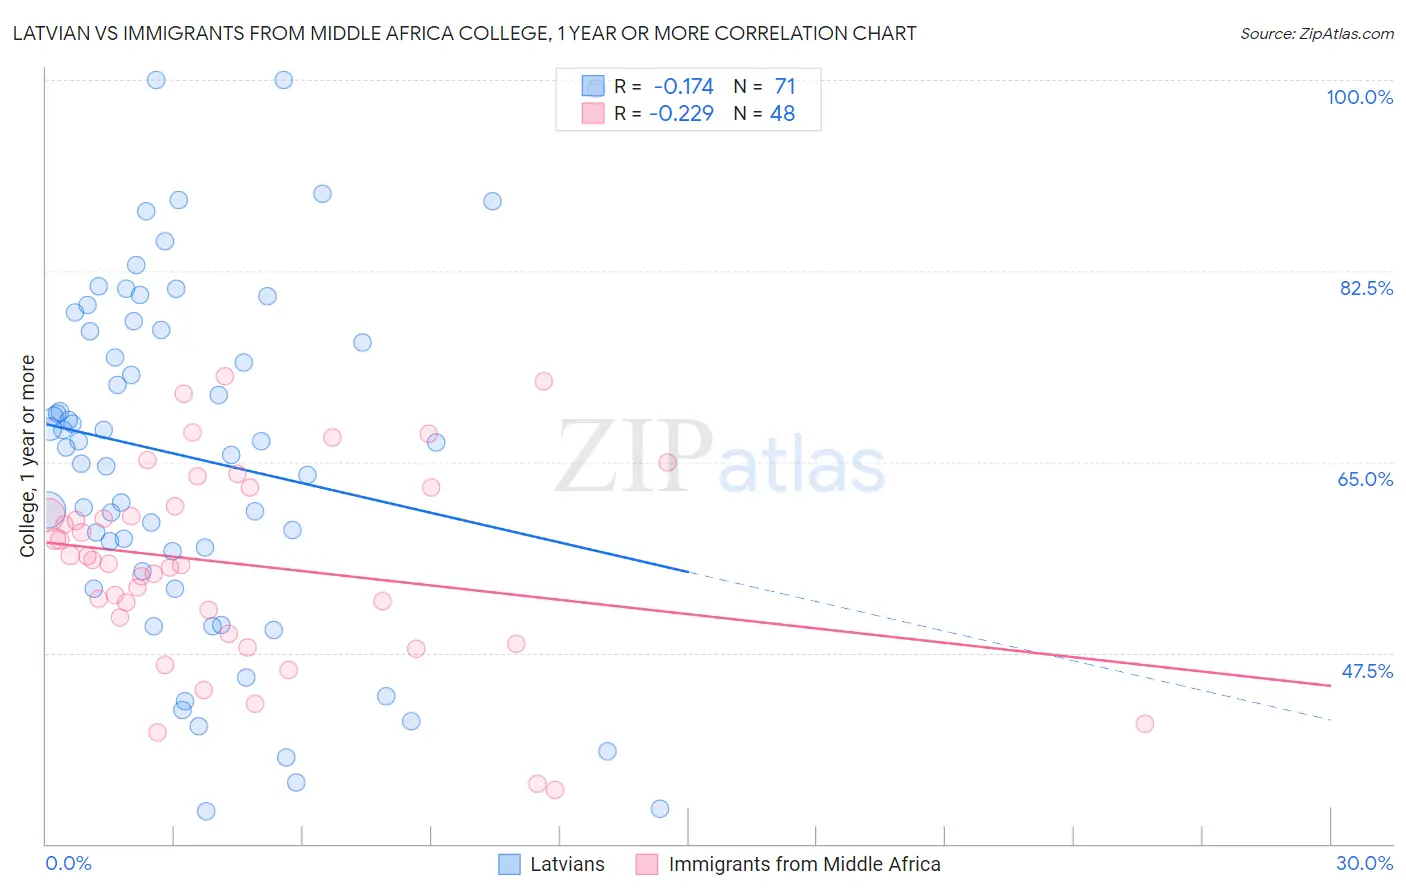
Latvian vs Immigrants from Middle Africa College, 1 year or more Correlation Chart
The statistical analysis conducted on geographies consisting of 220,726,880 people shows a poor negative correlation between the proportion of Latvians and percentage of population with at least college, 1 year or more education in the United States with a correlation coefficient (R) of -0.174 and weighted average of 66.1%. Similarly, the statistical analysis conducted on geographies consisting of 202,746,410 people shows a weak negative correlation between the proportion of Immigrants from Middle Africa and percentage of population with at least college, 1 year or more education in the United States with a correlation coefficient (R) of -0.229 and weighted average of 58.0%, a difference of 13.9%.
College, 1 year or more Correlation Summary
| Measurement | Latvian | Immigrants from Middle Africa |
| Minimum | 32.9% | 35.0% |
| Maximum | 100.0% | 72.8% |
| Range | 67.1% | 37.9% |
| Mean | 65.3% | 55.6% |
| Median | 66.8% | 55.8% |
| Interquartile 25% (IQ1) | 54.9% | 50.0% |
| Interquartile 75% (IQ3) | 77.1% | 61.8% |
| Interquartile Range (IQR) | 22.1% | 11.8% |
| Standard Deviation (Sample) | 16.2% | 9.1% |
| Standard Deviation (Population) | 16.1% | 9.0% |
Similar Demographics by College, 1 year or more
Demographics Similar to Latvians by College, 1 year or more
In terms of college, 1 year or more, the demographic groups most similar to Latvians are Indian (Asian) (66.1%, a difference of 0.040%), Immigrants from Ireland (65.9%, a difference of 0.20%), Immigrants from France (65.8%, a difference of 0.37%), Immigrants from Belgium (66.3%, a difference of 0.39%), and Immigrants from China (66.4%, a difference of 0.47%).
| Demographics | Rating | Rank | College, 1 year or more |
| Immigrants | Switzerland | 100.0 /100 | #19 | Exceptional 66.5% |
| Immigrants | Korea | 100.0 /100 | #20 | Exceptional 66.5% |
| Immigrants | Hong Kong | 100.0 /100 | #21 | Exceptional 66.4% |
| Soviet Union | 100.0 /100 | #22 | Exceptional 66.4% |
| Immigrants | China | 100.0 /100 | #23 | Exceptional 66.4% |
| Immigrants | Belgium | 100.0 /100 | #24 | Exceptional 66.3% |
| Indians (Asian) | 100.0 /100 | #25 | Exceptional 66.1% |
| Latvians | 100.0 /100 | #26 | Exceptional 66.1% |
| Immigrants | Ireland | 100.0 /100 | #27 | Exceptional 65.9% |
| Immigrants | France | 100.0 /100 | #28 | Exceptional 65.8% |
| Immigrants | Northern Europe | 100.0 /100 | #29 | Exceptional 65.6% |
| Immigrants | Denmark | 100.0 /100 | #30 | Exceptional 65.6% |
| Turks | 100.0 /100 | #31 | Exceptional 65.5% |
| Bulgarians | 100.0 /100 | #32 | Exceptional 65.5% |
| Immigrants | Sri Lanka | 99.9 /100 | #33 | Exceptional 65.4% |
Demographics Similar to Immigrants from Middle Africa by College, 1 year or more
In terms of college, 1 year or more, the demographic groups most similar to Immigrants from Middle Africa are Tsimshian (57.9%, a difference of 0.060%), Immigrants from Nigeria (57.9%, a difference of 0.080%), Immigrants from Uruguay (58.1%, a difference of 0.13%), Immigrants from Senegal (57.8%, a difference of 0.26%), and French Canadian (57.8%, a difference of 0.26%).
| Demographics | Rating | Rank | College, 1 year or more |
| Immigrants | South America | 21.9 /100 | #202 | Fair 58.4% |
| Ghanaians | 20.9 /100 | #203 | Fair 58.4% |
| Panamanians | 19.2 /100 | #204 | Poor 58.3% |
| Immigrants | Zaire | 18.7 /100 | #205 | Poor 58.3% |
| Immigrants | Vietnam | 18.2 /100 | #206 | Poor 58.2% |
| Senegalese | 16.9 /100 | #207 | Poor 58.2% |
| Immigrants | Uruguay | 15.2 /100 | #208 | Poor 58.1% |
| Immigrants | Middle Africa | 14.0 /100 | #209 | Poor 58.0% |
| Tsimshian | 13.5 /100 | #210 | Poor 57.9% |
| Immigrants | Nigeria | 13.3 /100 | #211 | Poor 57.9% |
| Immigrants | Senegal | 11.8 /100 | #212 | Poor 57.8% |
| French Canadians | 11.8 /100 | #213 | Poor 57.8% |
| Immigrants | Colombia | 11.6 /100 | #214 | Poor 57.8% |
| Tongans | 11.6 /100 | #215 | Poor 57.8% |
| Immigrants | Peru | 10.6 /100 | #216 | Poor 57.7% |