Latvian vs Immigrants from Portugal 11th Grade
COMPARE
Latvian
Immigrants from Portugal
11th Grade
11th Grade Comparison
Latvians
Immigrants from Portugal
94.7%
11TH GRADE
100.0/ 100
METRIC RATING
12th/ 347
METRIC RANK
89.3%
11TH GRADE
0.0/ 100
METRIC RATING
312th/ 347
METRIC RANK
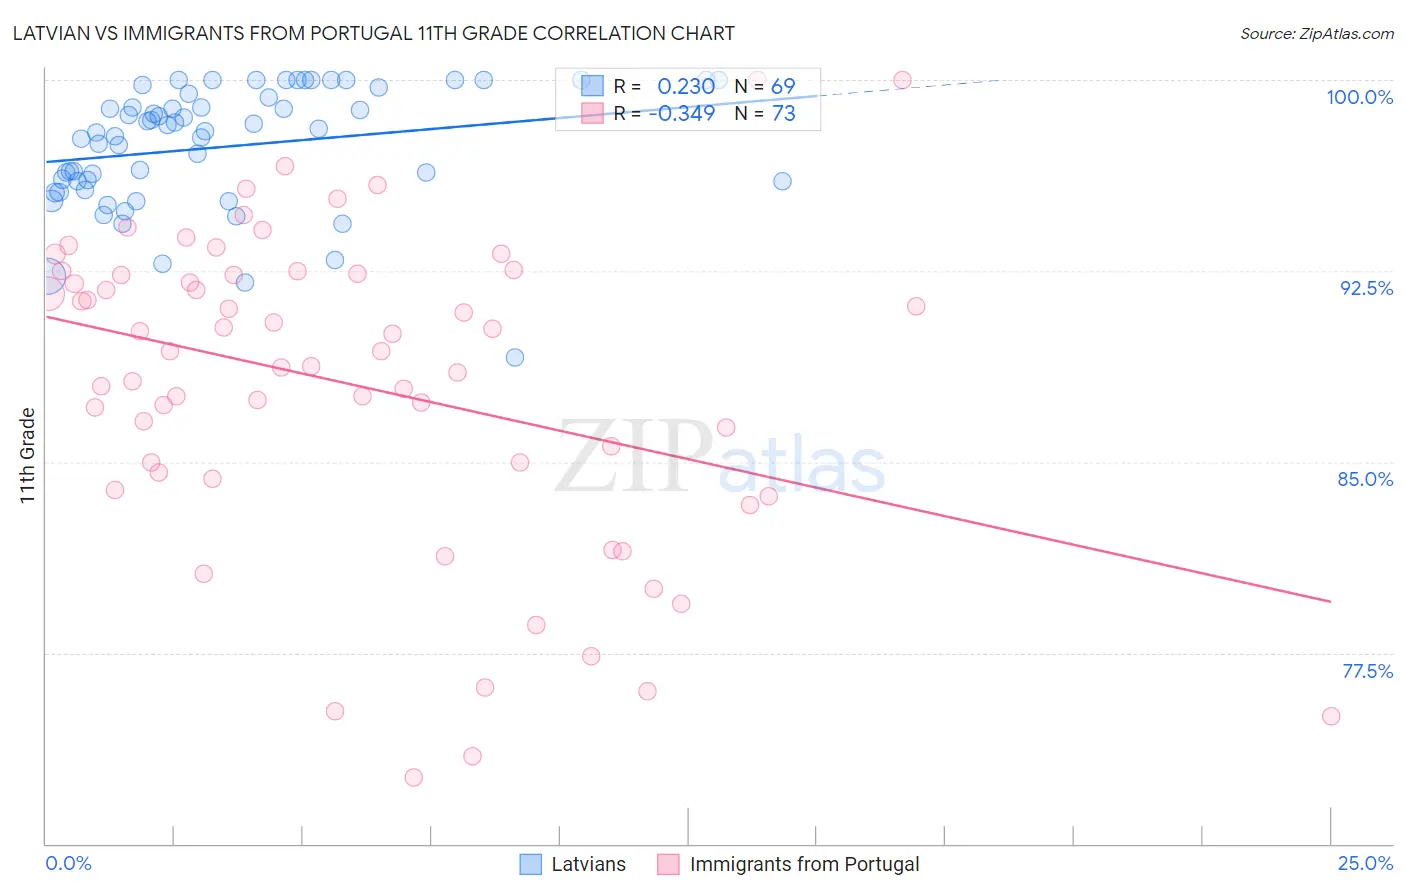
Latvian vs Immigrants from Portugal 11th Grade Correlation Chart
The statistical analysis conducted on geographies consisting of 220,726,252 people shows a weak positive correlation between the proportion of Latvians and percentage of population with at least 11th grade education in the United States with a correlation coefficient (R) of 0.230 and weighted average of 94.7%. Similarly, the statistical analysis conducted on geographies consisting of 174,792,107 people shows a mild negative correlation between the proportion of Immigrants from Portugal and percentage of population with at least 11th grade education in the United States with a correlation coefficient (R) of -0.349 and weighted average of 89.3%, a difference of 6.0%.
11th Grade Correlation Summary
| Measurement | Latvian | Immigrants from Portugal |
| Minimum | 89.1% | 72.6% |
| Maximum | 100.0% | 100.0% |
| Range | 10.9% | 27.4% |
| Mean | 97.4% | 88.0% |
| Median | 98.0% | 89.3% |
| Interquartile 25% (IQ1) | 95.8% | 84.4% |
| Interquartile 75% (IQ3) | 99.4% | 92.4% |
| Interquartile Range (IQR) | 3.6% | 7.9% |
| Standard Deviation (Sample) | 2.4% | 6.2% |
| Standard Deviation (Population) | 2.4% | 6.2% |
Similar Demographics by 11th Grade
Demographics Similar to Latvians by 11th Grade
In terms of 11th grade, the demographic groups most similar to Latvians are Finnish (94.7%, a difference of 0.0%), German (94.7%, a difference of 0.0%), Chinese (94.6%, a difference of 0.030%), Danish (94.7%, a difference of 0.050%), and Croatian (94.7%, a difference of 0.090%).
| Demographics | Rating | Rank | 11th Grade |
| Carpatho Rusyns | 100.0 /100 | #5 | Exceptional 94.8% |
| Lithuanians | 100.0 /100 | #6 | Exceptional 94.8% |
| Poles | 100.0 /100 | #7 | Exceptional 94.8% |
| Croatians | 100.0 /100 | #8 | Exceptional 94.7% |
| Danes | 100.0 /100 | #9 | Exceptional 94.7% |
| Finns | 100.0 /100 | #10 | Exceptional 94.7% |
| Germans | 100.0 /100 | #11 | Exceptional 94.7% |
| Latvians | 100.0 /100 | #12 | Exceptional 94.7% |
| Chinese | 100.0 /100 | #13 | Exceptional 94.6% |
| Eastern Europeans | 100.0 /100 | #14 | Exceptional 94.6% |
| Bulgarians | 100.0 /100 | #15 | Exceptional 94.5% |
| Immigrants | India | 100.0 /100 | #16 | Exceptional 94.5% |
| Luxembourgers | 100.0 /100 | #17 | Exceptional 94.5% |
| Maltese | 100.0 /100 | #18 | Exceptional 94.5% |
| Scandinavians | 100.0 /100 | #19 | Exceptional 94.5% |
Demographics Similar to Immigrants from Portugal by 11th Grade
In terms of 11th grade, the demographic groups most similar to Immigrants from Portugal are Vietnamese (89.4%, a difference of 0.18%), Immigrants from Caribbean (89.1%, a difference of 0.20%), Cape Verdean (89.1%, a difference of 0.22%), Immigrants from Ecuador (89.1%, a difference of 0.23%), and Yaqui (89.5%, a difference of 0.24%).
| Demographics | Rating | Rank | 11th Grade |
| Immigrants | Cambodia | 0.0 /100 | #305 | Tragic 89.6% |
| Ecuadorians | 0.0 /100 | #306 | Tragic 89.6% |
| Immigrants | Dominica | 0.0 /100 | #307 | Tragic 89.5% |
| Nepalese | 0.0 /100 | #308 | Tragic 89.5% |
| Immigrants | Bangladesh | 0.0 /100 | #309 | Tragic 89.5% |
| Yaqui | 0.0 /100 | #310 | Tragic 89.5% |
| Vietnamese | 0.0 /100 | #311 | Tragic 89.4% |
| Immigrants | Portugal | 0.0 /100 | #312 | Tragic 89.3% |
| Immigrants | Caribbean | 0.0 /100 | #313 | Tragic 89.1% |
| Cape Verdeans | 0.0 /100 | #314 | Tragic 89.1% |
| Immigrants | Ecuador | 0.0 /100 | #315 | Tragic 89.1% |
| Immigrants | Cuba | 0.0 /100 | #316 | Tragic 88.9% |
| Lumbee | 0.0 /100 | #317 | Tragic 88.9% |
| Nicaraguans | 0.0 /100 | #318 | Tragic 88.9% |
| Belizeans | 0.0 /100 | #319 | Tragic 88.8% |