Laotian vs Immigrants from Brazil 12th Grade, No Diploma
COMPARE
Laotian
Immigrants from Brazil
12th Grade, No Diploma
12th Grade, No Diploma Comparison
Laotians
Immigrants from Brazil
91.3%
12TH GRADE, NO DIPLOMA
64.4/ 100
METRIC RATING
159th/ 347
METRIC RANK
91.5%
12TH GRADE, NO DIPLOMA
79.8/ 100
METRIC RATING
146th/ 347
METRIC RANK
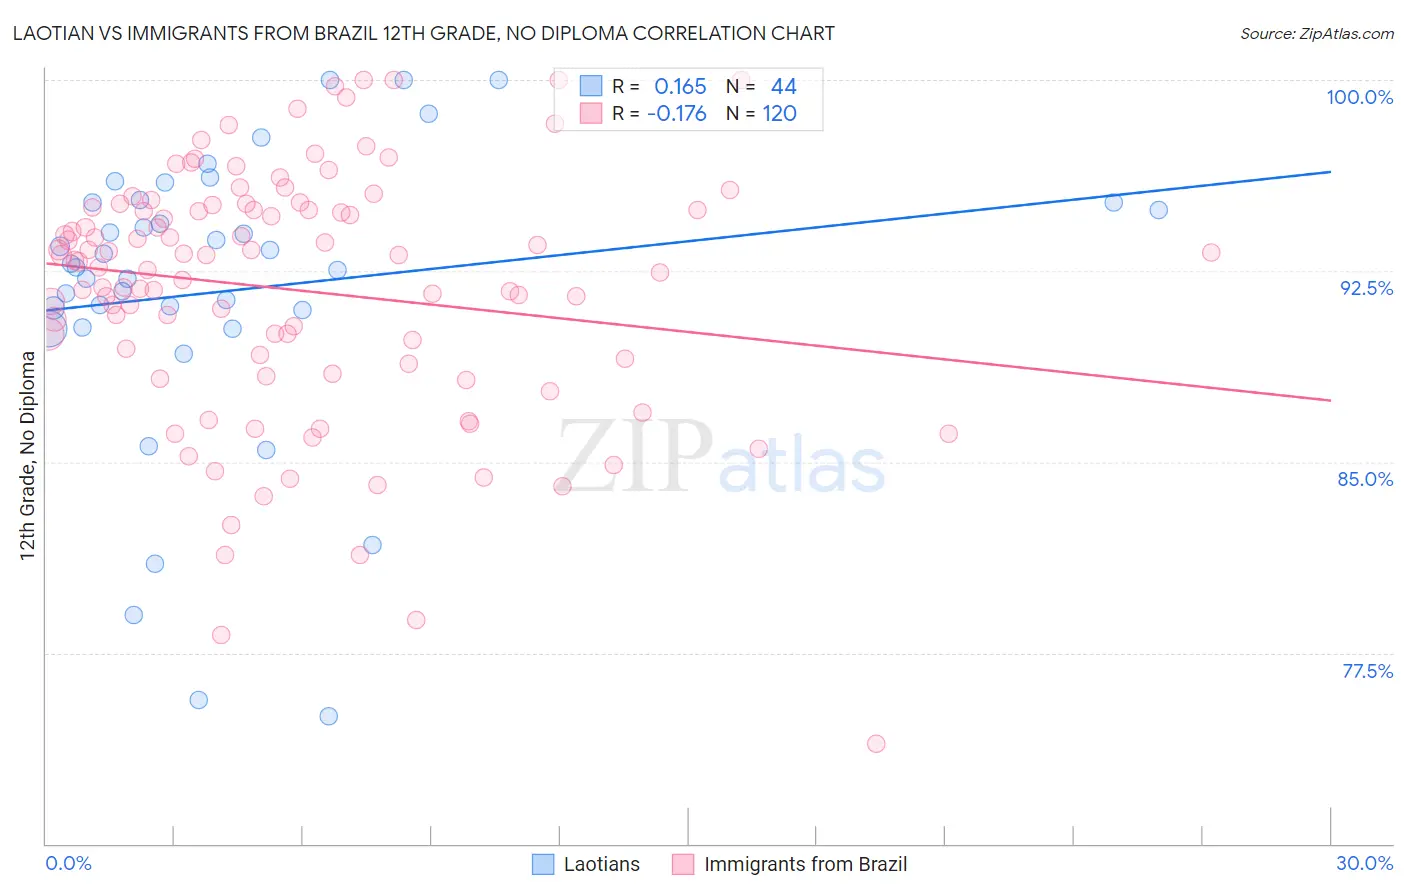
Laotian vs Immigrants from Brazil 12th Grade, No Diploma Correlation Chart
The statistical analysis conducted on geographies consisting of 224,854,130 people shows a poor positive correlation between the proportion of Laotians and percentage of population with at least 12th grade (no diploma) education in the United States with a correlation coefficient (R) of 0.165 and weighted average of 91.3%. Similarly, the statistical analysis conducted on geographies consisting of 343,008,543 people shows a poor negative correlation between the proportion of Immigrants from Brazil and percentage of population with at least 12th grade (no diploma) education in the United States with a correlation coefficient (R) of -0.176 and weighted average of 91.5%, a difference of 0.24%.
12th Grade, No Diploma Correlation Summary
| Measurement | Laotian | Immigrants from Brazil |
| Minimum | 75.0% | 73.9% |
| Maximum | 100.0% | 100.0% |
| Range | 25.0% | 26.1% |
| Mean | 91.7% | 91.7% |
| Median | 92.7% | 92.9% |
| Interquartile 25% (IQ1) | 90.6% | 89.0% |
| Interquartile 75% (IQ3) | 95.2% | 95.0% |
| Interquartile Range (IQR) | 4.6% | 6.0% |
| Standard Deviation (Sample) | 5.8% | 4.9% |
| Standard Deviation (Population) | 5.8% | 4.9% |
Demographics Similar to Laotians and Immigrants from Brazil by 12th Grade, No Diploma
In terms of 12th grade, no diploma, the demographic groups most similar to Laotians are Immigrants from Albania (91.3%, a difference of 0.0%), Immigrants from Hong Kong (91.3%, a difference of 0.010%), Immigrants from Northern Africa (91.4%, a difference of 0.020%), Brazilian (91.3%, a difference of 0.030%), and Immigrants from Pakistan (91.4%, a difference of 0.090%). Similarly, the demographic groups most similar to Immigrants from Brazil are Immigrants from Lebanon (91.6%, a difference of 0.0%), Pakistani (91.5%, a difference of 0.0%), Immigrants from Spain (91.6%, a difference of 0.010%), Indian (Asian) (91.5%, a difference of 0.010%), and Ugandan (91.5%, a difference of 0.010%).
| Demographics | Rating | Rank | 12th Grade, No Diploma |
| Immigrants | Venezuela | 80.9 /100 | #142 | Excellent 91.6% |
| Immigrants | Argentina | 80.7 /100 | #143 | Excellent 91.6% |
| Immigrants | Spain | 80.1 /100 | #144 | Excellent 91.6% |
| Immigrants | Lebanon | 80.0 /100 | #145 | Excellent 91.6% |
| Immigrants | Brazil | 79.8 /100 | #146 | Good 91.5% |
| Pakistanis | 79.6 /100 | #147 | Good 91.5% |
| Indians (Asian) | 79.4 /100 | #148 | Good 91.5% |
| Ugandans | 79.0 /100 | #149 | Good 91.5% |
| Paraguayans | 78.9 /100 | #150 | Good 91.5% |
| Chippewa | 78.8 /100 | #151 | Good 91.5% |
| Kenyans | 77.4 /100 | #152 | Good 91.5% |
| Iraqis | 75.3 /100 | #153 | Good 91.5% |
| Immigrants | Kenya | 73.9 /100 | #154 | Good 91.5% |
| Immigrants | Iraq | 73.0 /100 | #155 | Good 91.4% |
| Asians | 71.9 /100 | #156 | Good 91.4% |
| Immigrants | Pakistan | 70.7 /100 | #157 | Good 91.4% |
| Immigrants | Northern Africa | 66.2 /100 | #158 | Good 91.4% |
| Laotians | 64.4 /100 | #159 | Good 91.3% |
| Immigrants | Albania | 64.1 /100 | #160 | Good 91.3% |
| Immigrants | Hong Kong | 63.8 /100 | #161 | Good 91.3% |
| Brazilians | 62.0 /100 | #162 | Good 91.3% |