Laotian vs French Canadian Bachelor's Degree
COMPARE
Laotian
French Canadian
Bachelor's Degree
Bachelor's Degree Comparison
Laotians
French Canadians
42.0%
BACHELOR'S DEGREE
98.9/ 100
METRIC RATING
90th/ 347
METRIC RANK
35.6%
BACHELOR'S DEGREE
8.3/ 100
METRIC RATING
223rd/ 347
METRIC RANK
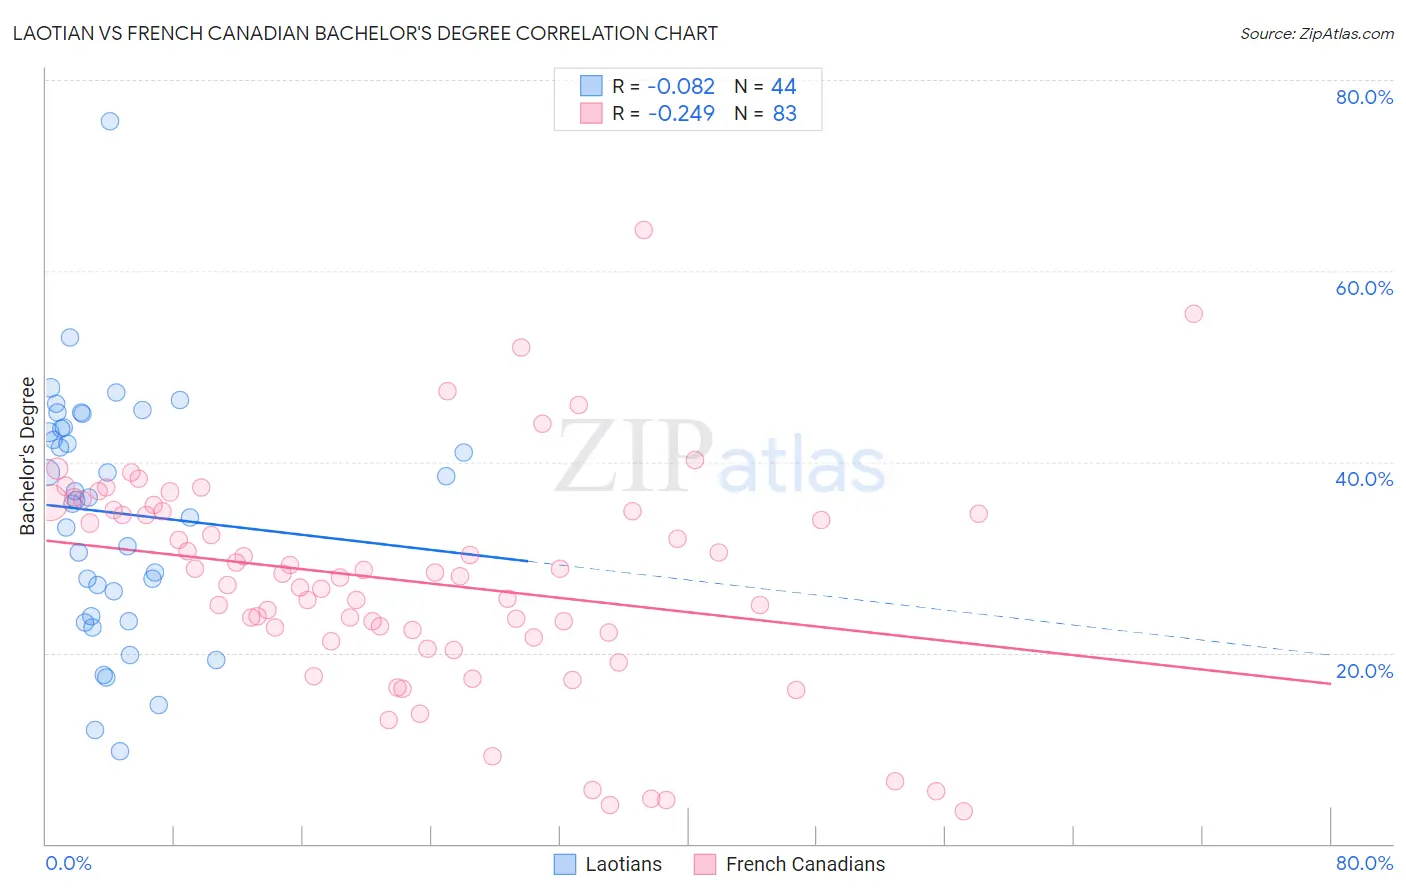
Laotian vs French Canadian Bachelor's Degree Correlation Chart
The statistical analysis conducted on geographies consisting of 224,838,887 people shows a slight negative correlation between the proportion of Laotians and percentage of population with at least bachelor's degree education in the United States with a correlation coefficient (R) of -0.082 and weighted average of 42.0%. Similarly, the statistical analysis conducted on geographies consisting of 502,615,411 people shows a weak negative correlation between the proportion of French Canadians and percentage of population with at least bachelor's degree education in the United States with a correlation coefficient (R) of -0.249 and weighted average of 35.6%, a difference of 17.9%.
Bachelor's Degree Correlation Summary
| Measurement | Laotian | French Canadian |
| Minimum | 9.7% | 3.4% |
| Maximum | 75.7% | 64.3% |
| Range | 66.0% | 60.9% |
| Mean | 34.6% | 27.5% |
| Median | 36.1% | 28.0% |
| Interquartile 25% (IQ1) | 25.1% | 21.6% |
| Interquartile 75% (IQ3) | 43.5% | 34.8% |
| Interquartile Range (IQR) | 18.4% | 13.2% |
| Standard Deviation (Sample) | 12.7% | 11.6% |
| Standard Deviation (Population) | 12.6% | 11.5% |
Similar Demographics by Bachelor's Degree
Demographics Similar to Laotians by Bachelor's Degree
In terms of bachelor's degree, the demographic groups most similar to Laotians are Immigrants from Northern Africa (41.9%, a difference of 0.10%), Greek (42.0%, a difference of 0.12%), Immigrants from Western Europe (42.0%, a difference of 0.13%), Maltese (41.9%, a difference of 0.17%), and Carpatho Rusyn (42.1%, a difference of 0.25%).
| Demographics | Rating | Rank | Bachelor's Degree |
| Armenians | 99.2 /100 | #83 | Exceptional 42.3% |
| Immigrants | Western Asia | 99.2 /100 | #84 | Exceptional 42.3% |
| Lithuanians | 99.2 /100 | #85 | Exceptional 42.2% |
| Immigrants | Brazil | 99.2 /100 | #86 | Exceptional 42.2% |
| Carpatho Rusyns | 99.0 /100 | #87 | Exceptional 42.1% |
| Immigrants | Western Europe | 99.0 /100 | #88 | Exceptional 42.0% |
| Greeks | 99.0 /100 | #89 | Exceptional 42.0% |
| Laotians | 98.9 /100 | #90 | Exceptional 42.0% |
| Immigrants | Northern Africa | 98.9 /100 | #91 | Exceptional 41.9% |
| Maltese | 98.8 /100 | #92 | Exceptional 41.9% |
| Immigrants | Canada | 98.6 /100 | #93 | Exceptional 41.7% |
| Immigrants | Nepal | 98.6 /100 | #94 | Exceptional 41.7% |
| Immigrants | North America | 98.5 /100 | #95 | Exceptional 41.7% |
| Immigrants | Moldova | 98.4 /100 | #96 | Exceptional 41.6% |
| Romanians | 98.4 /100 | #97 | Exceptional 41.6% |
Demographics Similar to French Canadians by Bachelor's Degree
In terms of bachelor's degree, the demographic groups most similar to French Canadians are Trinidadian and Tobagonian (35.7%, a difference of 0.18%), Immigrants from Barbados (35.5%, a difference of 0.28%), Dutch (35.7%, a difference of 0.32%), Immigrants from Burma/Myanmar (35.5%, a difference of 0.35%), and Portuguese (35.5%, a difference of 0.38%).
| Demographics | Rating | Rank | Bachelor's Degree |
| Barbadians | 13.5 /100 | #216 | Poor 36.1% |
| German Russians | 10.2 /100 | #217 | Poor 35.8% |
| Sub-Saharan Africans | 9.8 /100 | #218 | Tragic 35.8% |
| West Indians | 9.7 /100 | #219 | Tragic 35.8% |
| Spanish | 9.6 /100 | #220 | Tragic 35.8% |
| Dutch | 9.2 /100 | #221 | Tragic 35.7% |
| Trinidadians and Tobagonians | 8.8 /100 | #222 | Tragic 35.7% |
| French Canadians | 8.3 /100 | #223 | Tragic 35.6% |
| Immigrants | Barbados | 7.5 /100 | #224 | Tragic 35.5% |
| Immigrants | Burma/Myanmar | 7.3 /100 | #225 | Tragic 35.5% |
| Portuguese | 7.2 /100 | #226 | Tragic 35.5% |
| Ecuadorians | 6.6 /100 | #227 | Tragic 35.4% |
| Immigrants | Trinidad and Tobago | 6.0 /100 | #228 | Tragic 35.3% |
| Whites/Caucasians | 5.9 /100 | #229 | Tragic 35.3% |
| Immigrants | Grenada | 4.3 /100 | #230 | Tragic 35.0% |