Laotian vs Immigrants from Poland 9th Grade
COMPARE
Laotian
Immigrants from Poland
9th Grade
9th Grade Comparison
Laotians
Immigrants from Poland
94.6%
9TH GRADE
21.0/ 100
METRIC RATING
199th/ 347
METRIC RANK
94.9%
9TH GRADE
46.7/ 100
METRIC RATING
178th/ 347
METRIC RANK
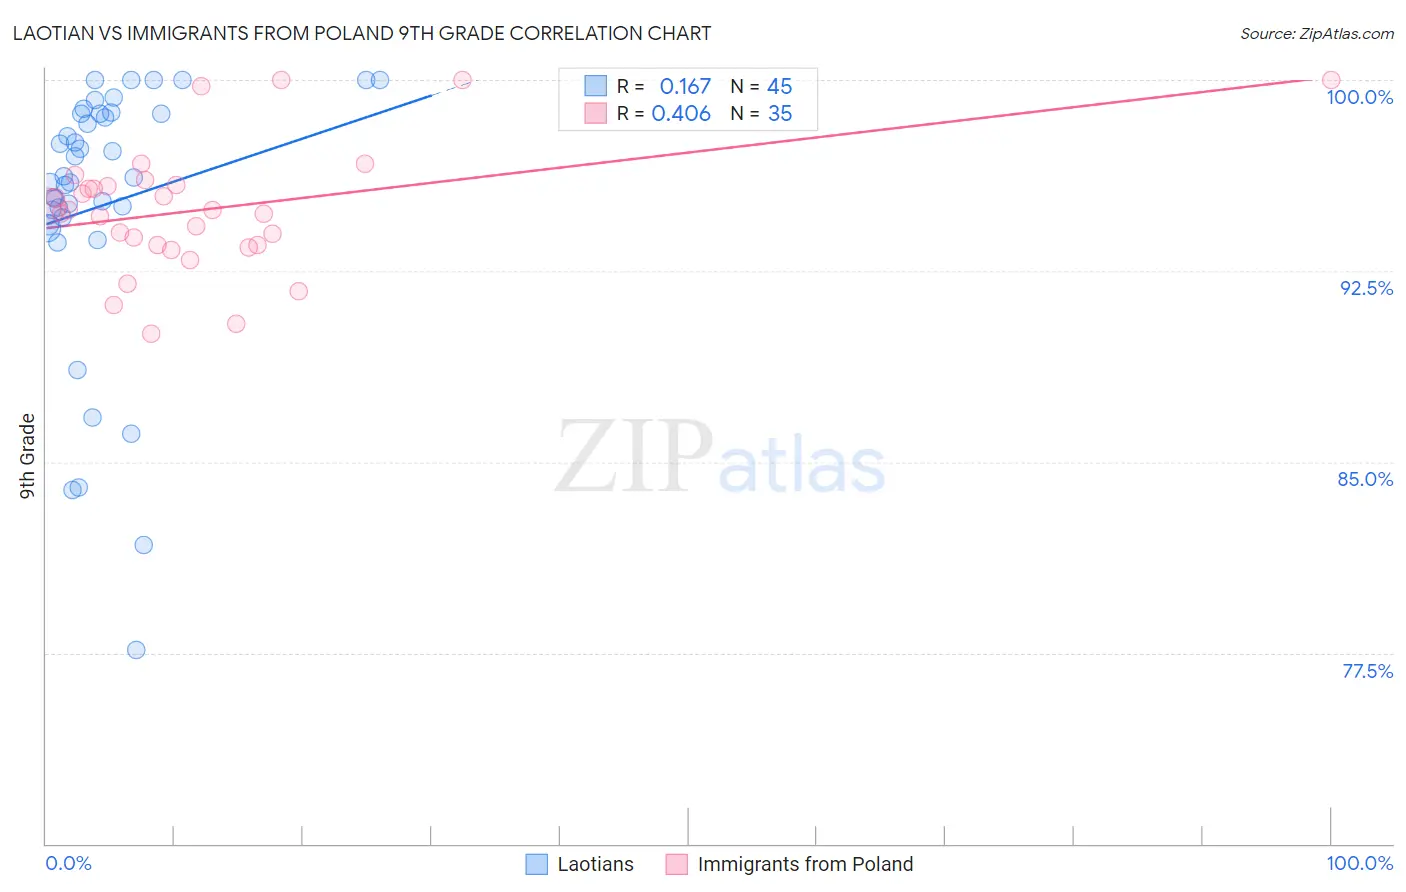
Laotian vs Immigrants from Poland 9th Grade Correlation Chart
The statistical analysis conducted on geographies consisting of 224,856,886 people shows a poor positive correlation between the proportion of Laotians and percentage of population with at least 9th grade education in the United States with a correlation coefficient (R) of 0.167 and weighted average of 94.6%. Similarly, the statistical analysis conducted on geographies consisting of 304,861,877 people shows a moderate positive correlation between the proportion of Immigrants from Poland and percentage of population with at least 9th grade education in the United States with a correlation coefficient (R) of 0.406 and weighted average of 94.9%, a difference of 0.22%.
9th Grade Correlation Summary
| Measurement | Laotian | Immigrants from Poland |
| Minimum | 77.6% | 90.0% |
| Maximum | 100.0% | 100.0% |
| Range | 22.4% | 10.0% |
| Mean | 95.1% | 94.9% |
| Median | 96.2% | 94.9% |
| Interquartile 25% (IQ1) | 94.4% | 93.5% |
| Interquartile 75% (IQ3) | 98.7% | 95.9% |
| Interquartile Range (IQR) | 4.2% | 2.3% |
| Standard Deviation (Sample) | 5.3% | 2.5% |
| Standard Deviation (Population) | 5.2% | 2.4% |
Similar Demographics by 9th Grade
Demographics Similar to Laotians by 9th Grade
In terms of 9th grade, the demographic groups most similar to Laotians are Immigrants from Zaire (94.6%, a difference of 0.0%), Black/African American (94.6%, a difference of 0.010%), Immigrants from Eastern Asia (94.6%, a difference of 0.010%), Immigrants from Bahamas (94.6%, a difference of 0.010%), and Hawaiian (94.7%, a difference of 0.020%).
| Demographics | Rating | Rank | 9th Grade |
| Immigrants | Northern Africa | 30.7 /100 | #192 | Fair 94.7% |
| Paraguayans | 30.1 /100 | #193 | Fair 94.7% |
| Panamanians | 29.0 /100 | #194 | Fair 94.7% |
| Marshallese | 27.9 /100 | #195 | Fair 94.7% |
| Immigrants | Lebanon | 27.2 /100 | #196 | Fair 94.7% |
| Immigrants | Micronesia | 24.7 /100 | #197 | Fair 94.7% |
| Hawaiians | 22.7 /100 | #198 | Fair 94.7% |
| Laotians | 21.0 /100 | #199 | Fair 94.6% |
| Immigrants | Zaire | 20.6 /100 | #200 | Fair 94.6% |
| Blacks/African Americans | 20.5 /100 | #201 | Fair 94.6% |
| Immigrants | Eastern Asia | 19.8 /100 | #202 | Poor 94.6% |
| Immigrants | Bahamas | 19.8 /100 | #203 | Poor 94.6% |
| Moroccans | 19.6 /100 | #204 | Poor 94.6% |
| Immigrants | Sudan | 17.6 /100 | #205 | Poor 94.6% |
| Samoans | 17.3 /100 | #206 | Poor 94.6% |
Demographics Similar to Immigrants from Poland by 9th Grade
In terms of 9th grade, the demographic groups most similar to Immigrants from Poland are Immigrants from Venezuela (94.9%, a difference of 0.0%), Immigrants from Iraq (94.9%, a difference of 0.010%), Immigrants from Egypt (94.9%, a difference of 0.020%), Brazilian (94.9%, a difference of 0.020%), and Immigrants from Spain (94.9%, a difference of 0.020%).
| Demographics | Rating | Rank | 9th Grade |
| Colville | 58.5 /100 | #171 | Average 94.9% |
| Iraqis | 54.0 /100 | #172 | Average 94.9% |
| Cheyenne | 51.5 /100 | #173 | Average 94.9% |
| Immigrants | Egypt | 50.0 /100 | #174 | Average 94.9% |
| Brazilians | 49.8 /100 | #175 | Average 94.9% |
| Immigrants | Spain | 49.1 /100 | #176 | Average 94.9% |
| Immigrants | Iraq | 47.8 /100 | #177 | Average 94.9% |
| Immigrants | Poland | 46.7 /100 | #178 | Average 94.9% |
| Immigrants | Venezuela | 46.5 /100 | #179 | Average 94.9% |
| Immigrants | Uganda | 43.1 /100 | #180 | Average 94.8% |
| Sierra Leoneans | 42.7 /100 | #181 | Average 94.8% |
| Seminole | 42.5 /100 | #182 | Average 94.8% |
| Immigrants | Nepal | 39.7 /100 | #183 | Fair 94.8% |
| Argentineans | 37.6 /100 | #184 | Fair 94.8% |
| Liberians | 37.4 /100 | #185 | Fair 94.8% |