Korean vs Guyanese 10th Grade
COMPARE
Korean
Guyanese
10th Grade
10th Grade Comparison
Koreans
Guyanese
93.2%
10TH GRADE
6.1/ 100
METRIC RATING
226th/ 347
METRIC RANK
91.4%
10TH GRADE
0.0/ 100
METRIC RATING
300th/ 347
METRIC RANK
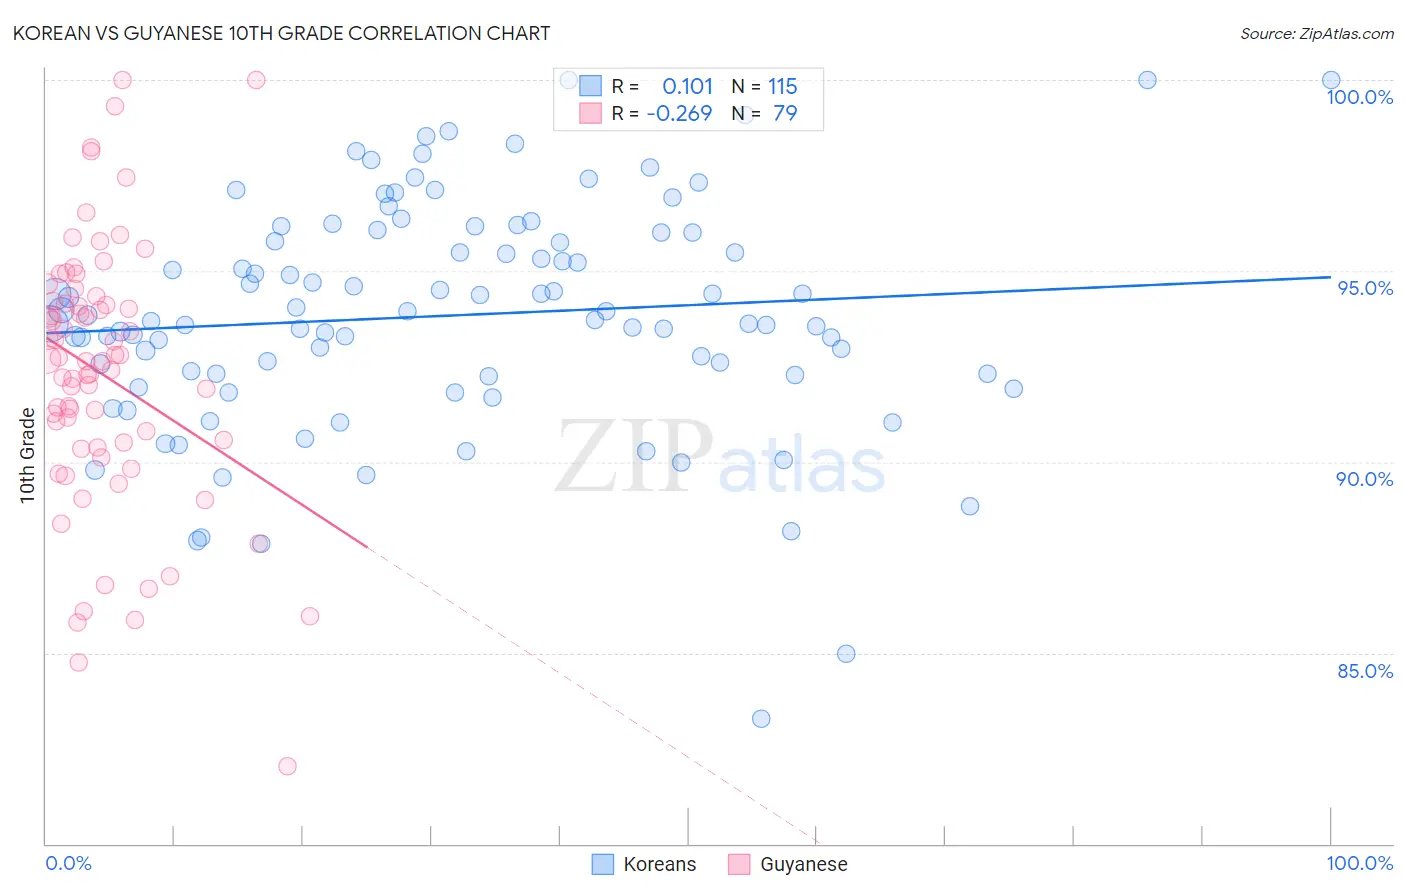
Korean vs Guyanese 10th Grade Correlation Chart
The statistical analysis conducted on geographies consisting of 510,943,943 people shows a poor positive correlation between the proportion of Koreans and percentage of population with at least 10th grade education in the United States with a correlation coefficient (R) of 0.101 and weighted average of 93.2%. Similarly, the statistical analysis conducted on geographies consisting of 176,937,226 people shows a weak negative correlation between the proportion of Guyanese and percentage of population with at least 10th grade education in the United States with a correlation coefficient (R) of -0.269 and weighted average of 91.4%, a difference of 2.0%.
10th Grade Correlation Summary
| Measurement | Korean | Guyanese |
| Minimum | 83.3% | 82.0% |
| Maximum | 100.0% | 100.0% |
| Range | 16.7% | 18.0% |
| Mean | 93.8% | 92.3% |
| Median | 93.7% | 92.6% |
| Interquartile 25% (IQ1) | 92.3% | 90.4% |
| Interquartile 75% (IQ3) | 96.0% | 94.2% |
| Interquartile Range (IQR) | 3.7% | 3.8% |
| Standard Deviation (Sample) | 3.0% | 3.5% |
| Standard Deviation (Population) | 3.0% | 3.5% |
Similar Demographics by 10th Grade
Demographics Similar to Koreans by 10th Grade
In terms of 10th grade, the demographic groups most similar to Koreans are Somali (93.2%, a difference of 0.0%), Black/African American (93.2%, a difference of 0.0%), Immigrants from China (93.2%, a difference of 0.010%), Bolivian (93.2%, a difference of 0.020%), and Immigrants from Ethiopia (93.1%, a difference of 0.040%).
| Demographics | Rating | Rank | 10th Grade |
| Seminole | 10.2 /100 | #219 | Poor 93.3% |
| Tongans | 9.5 /100 | #220 | Tragic 93.3% |
| Immigrants | Southern Europe | 8.9 /100 | #221 | Tragic 93.2% |
| Ethiopians | 7.9 /100 | #222 | Tragic 93.2% |
| Immigrants | Sierra Leone | 7.6 /100 | #223 | Tragic 93.2% |
| Bolivians | 6.7 /100 | #224 | Tragic 93.2% |
| Somalis | 6.2 /100 | #225 | Tragic 93.2% |
| Koreans | 6.1 /100 | #226 | Tragic 93.2% |
| Blacks/African Americans | 6.0 /100 | #227 | Tragic 93.2% |
| Immigrants | China | 5.9 /100 | #228 | Tragic 93.2% |
| Immigrants | Ethiopia | 5.1 /100 | #229 | Tragic 93.1% |
| Immigrants | Africa | 5.0 /100 | #230 | Tragic 93.1% |
| South American Indians | 4.9 /100 | #231 | Tragic 93.1% |
| Bahamians | 4.9 /100 | #232 | Tragic 93.1% |
| Comanche | 4.9 /100 | #233 | Tragic 93.1% |
Demographics Similar to Guyanese by 10th Grade
In terms of 10th grade, the demographic groups most similar to Guyanese are Immigrants from Haiti (91.4%, a difference of 0.050%), Cuban (91.5%, a difference of 0.12%), Fijian (91.5%, a difference of 0.15%), Japanese (91.2%, a difference of 0.15%), and Immigrants from Guyana (91.2%, a difference of 0.16%).
| Demographics | Rating | Rank | 10th Grade |
| Indonesians | 0.0 /100 | #293 | Tragic 91.8% |
| Haitians | 0.0 /100 | #294 | Tragic 91.8% |
| Lumbee | 0.0 /100 | #295 | Tragic 91.7% |
| Immigrants | Grenada | 0.0 /100 | #296 | Tragic 91.6% |
| Fijians | 0.0 /100 | #297 | Tragic 91.5% |
| Cubans | 0.0 /100 | #298 | Tragic 91.5% |
| Immigrants | Haiti | 0.0 /100 | #299 | Tragic 91.4% |
| Guyanese | 0.0 /100 | #300 | Tragic 91.4% |
| Japanese | 0.0 /100 | #301 | Tragic 91.2% |
| Immigrants | Guyana | 0.0 /100 | #302 | Tragic 91.2% |
| Immigrants | Vietnam | 0.0 /100 | #303 | Tragic 91.2% |
| Pima | 0.0 /100 | #304 | Tragic 91.2% |
| Immigrants | Dominica | 0.0 /100 | #305 | Tragic 91.1% |
| Yaqui | 0.0 /100 | #306 | Tragic 91.1% |
| Immigrants | Fiji | 0.0 /100 | #307 | Tragic 91.0% |