South American Indian vs Panamanian 9th Grade
COMPARE
South American Indian
Panamanian
9th Grade
9th Grade Comparison
South American Indians
Panamanians
94.3%
9TH GRADE
2.8/ 100
METRIC RATING
238th/ 347
METRIC RANK
94.7%
9TH GRADE
29.0/ 100
METRIC RATING
194th/ 347
METRIC RANK
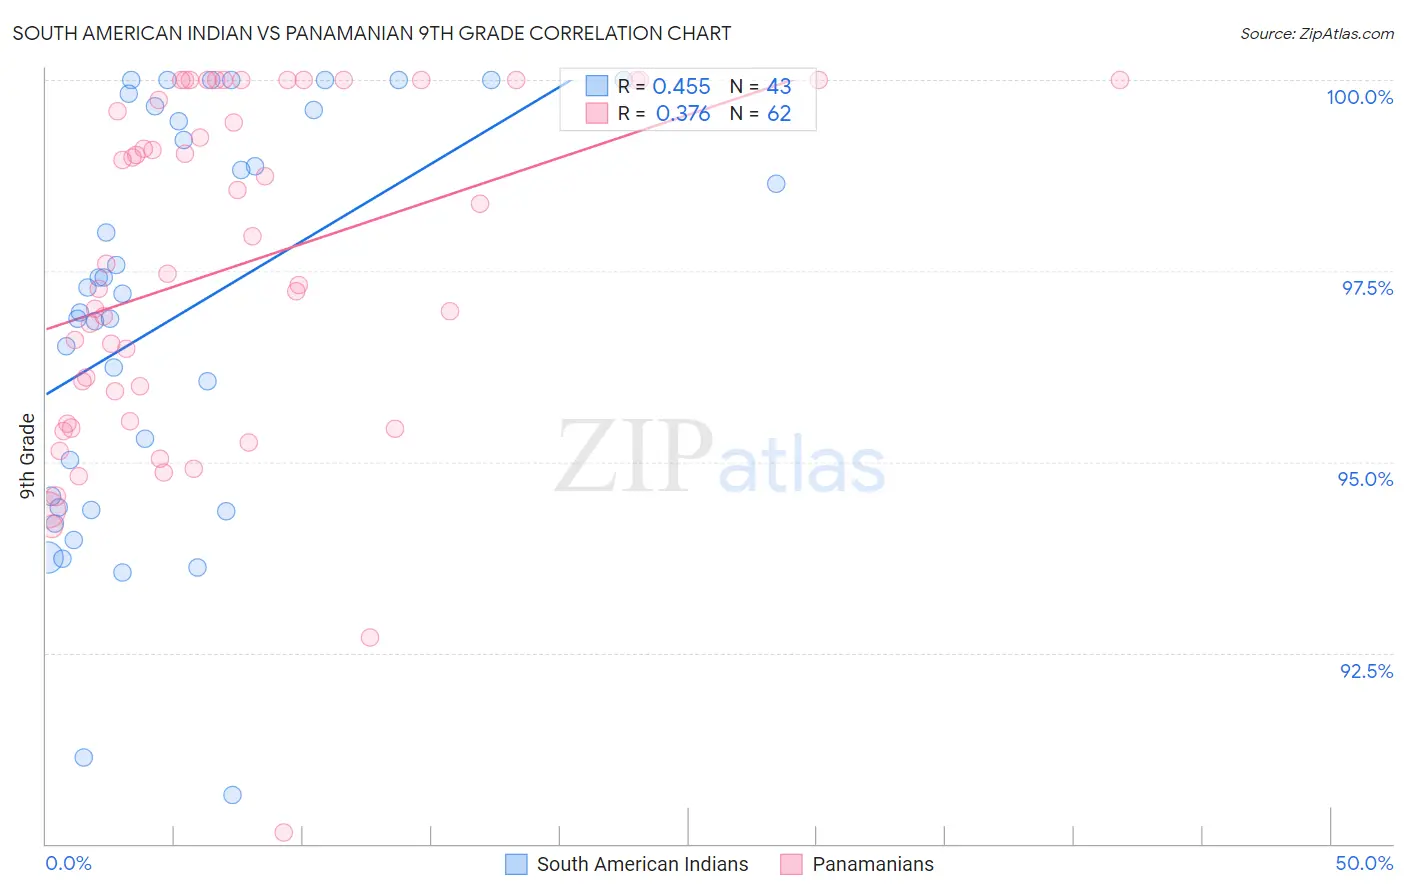
South American Indian vs Panamanian 9th Grade Correlation Chart
The statistical analysis conducted on geographies consisting of 164,573,401 people shows a moderate positive correlation between the proportion of South American Indians and percentage of population with at least 9th grade education in the United States with a correlation coefficient (R) of 0.455 and weighted average of 94.3%. Similarly, the statistical analysis conducted on geographies consisting of 281,248,945 people shows a mild positive correlation between the proportion of Panamanians and percentage of population with at least 9th grade education in the United States with a correlation coefficient (R) of 0.376 and weighted average of 94.7%, a difference of 0.49%.
9th Grade Correlation Summary
| Measurement | South American Indian | Panamanian |
| Minimum | 90.6% | 90.1% |
| Maximum | 100.0% | 100.0% |
| Range | 9.4% | 9.9% |
| Mean | 96.9% | 97.5% |
| Median | 97.2% | 97.5% |
| Interquartile 25% (IQ1) | 94.4% | 95.5% |
| Interquartile 75% (IQ3) | 99.6% | 100.0% |
| Interquartile Range (IQR) | 5.2% | 4.5% |
| Standard Deviation (Sample) | 2.6% | 2.3% |
| Standard Deviation (Population) | 2.6% | 2.2% |
Similar Demographics by 9th Grade
Demographics Similar to South American Indians by 9th Grade
In terms of 9th grade, the demographic groups most similar to South American Indians are Korean (94.3%, a difference of 0.0%), Immigrants from China (94.3%, a difference of 0.0%), Somali (94.3%, a difference of 0.010%), Immigrants from Ethiopia (94.3%, a difference of 0.010%), and Spanish American (94.2%, a difference of 0.010%).
| Demographics | Rating | Rank | 9th Grade |
| Immigrants | Panama | 4.0 /100 | #231 | Tragic 94.3% |
| Immigrants | Africa | 3.9 /100 | #232 | Tragic 94.3% |
| Nigerians | 3.7 /100 | #233 | Tragic 94.3% |
| Costa Ricans | 3.5 /100 | #234 | Tragic 94.3% |
| Bolivians | 3.3 /100 | #235 | Tragic 94.3% |
| Somalis | 2.9 /100 | #236 | Tragic 94.3% |
| Koreans | 2.9 /100 | #237 | Tragic 94.3% |
| South American Indians | 2.8 /100 | #238 | Tragic 94.3% |
| Immigrants | China | 2.8 /100 | #239 | Tragic 94.3% |
| Immigrants | Ethiopia | 2.7 /100 | #240 | Tragic 94.3% |
| Spanish Americans | 2.6 /100 | #241 | Tragic 94.2% |
| Immigrants | Middle Africa | 2.2 /100 | #242 | Tragic 94.2% |
| Immigrants | Cameroon | 2.1 /100 | #243 | Tragic 94.2% |
| Dutch West Indians | 2.0 /100 | #244 | Tragic 94.2% |
| Paiute | 1.9 /100 | #245 | Tragic 94.2% |
Demographics Similar to Panamanians by 9th Grade
In terms of 9th grade, the demographic groups most similar to Panamanians are Immigrants from Northern Africa (94.7%, a difference of 0.010%), Paraguayan (94.7%, a difference of 0.010%), Marshallese (94.7%, a difference of 0.010%), Immigrants from Lebanon (94.7%, a difference of 0.020%), and Sudanese (94.7%, a difference of 0.030%).
| Demographics | Rating | Rank | 9th Grade |
| Guamanians/Chamorros | 35.5 /100 | #187 | Fair 94.8% |
| Immigrants | Albania | 34.5 /100 | #188 | Fair 94.8% |
| Immigrants | Argentina | 34.4 /100 | #189 | Fair 94.8% |
| Sudanese | 32.7 /100 | #190 | Fair 94.7% |
| Assyrians/Chaldeans/Syriacs | 32.0 /100 | #191 | Fair 94.7% |
| Immigrants | Northern Africa | 30.7 /100 | #192 | Fair 94.7% |
| Paraguayans | 30.1 /100 | #193 | Fair 94.7% |
| Panamanians | 29.0 /100 | #194 | Fair 94.7% |
| Marshallese | 27.9 /100 | #195 | Fair 94.7% |
| Immigrants | Lebanon | 27.2 /100 | #196 | Fair 94.7% |
| Immigrants | Micronesia | 24.7 /100 | #197 | Fair 94.7% |
| Hawaiians | 22.7 /100 | #198 | Fair 94.7% |
| Laotians | 21.0 /100 | #199 | Fair 94.6% |
| Immigrants | Zaire | 20.6 /100 | #200 | Fair 94.6% |
| Blacks/African Americans | 20.5 /100 | #201 | Fair 94.6% |