West Indian vs Panamanian 9th Grade
COMPARE
West Indian
Panamanian
9th Grade
9th Grade Comparison
West Indians
Panamanians
93.7%
9TH GRADE
0.2/ 100
METRIC RATING
276th/ 347
METRIC RANK
94.7%
9TH GRADE
29.0/ 100
METRIC RATING
194th/ 347
METRIC RANK
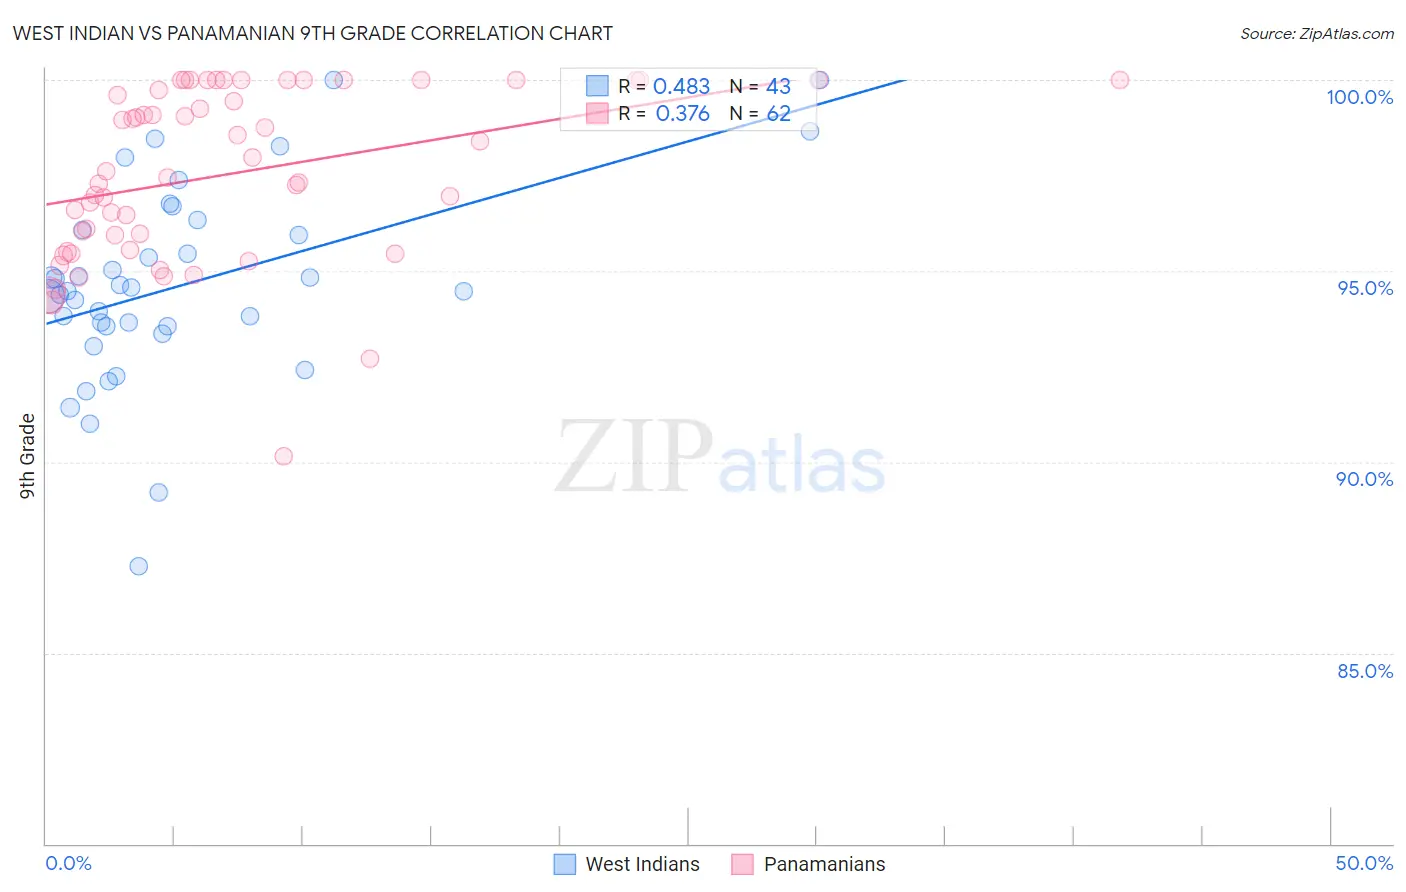
West Indian vs Panamanian 9th Grade Correlation Chart
The statistical analysis conducted on geographies consisting of 254,059,006 people shows a moderate positive correlation between the proportion of West Indians and percentage of population with at least 9th grade education in the United States with a correlation coefficient (R) of 0.483 and weighted average of 93.7%. Similarly, the statistical analysis conducted on geographies consisting of 281,248,945 people shows a mild positive correlation between the proportion of Panamanians and percentage of population with at least 9th grade education in the United States with a correlation coefficient (R) of 0.376 and weighted average of 94.7%, a difference of 1.0%.
9th Grade Correlation Summary
| Measurement | West Indian | Panamanian |
| Minimum | 87.3% | 90.1% |
| Maximum | 100.0% | 100.0% |
| Range | 12.7% | 9.9% |
| Mean | 94.6% | 97.5% |
| Median | 94.5% | 97.5% |
| Interquartile 25% (IQ1) | 93.5% | 95.5% |
| Interquartile 75% (IQ3) | 96.1% | 100.0% |
| Interquartile Range (IQR) | 2.5% | 4.5% |
| Standard Deviation (Sample) | 2.6% | 2.3% |
| Standard Deviation (Population) | 2.6% | 2.2% |
Similar Demographics by 9th Grade
Demographics Similar to West Indians by 9th Grade
In terms of 9th grade, the demographic groups most similar to West Indians are Immigrants from Philippines (93.7%, a difference of 0.010%), Immigrants from Eritrea (93.7%, a difference of 0.010%), Immigrants from Colombia (93.8%, a difference of 0.020%), Immigrants from South America (93.8%, a difference of 0.030%), and Peruvian (93.8%, a difference of 0.030%).
| Demographics | Rating | Rank | 9th Grade |
| Immigrants | Uruguay | 0.2 /100 | #269 | Tragic 93.8% |
| Yuman | 0.2 /100 | #270 | Tragic 93.8% |
| Immigrants | Ghana | 0.2 /100 | #271 | Tragic 93.8% |
| Immigrants | Western Africa | 0.2 /100 | #272 | Tragic 93.8% |
| Immigrants | South America | 0.2 /100 | #273 | Tragic 93.8% |
| Peruvians | 0.2 /100 | #274 | Tragic 93.8% |
| Immigrants | Colombia | 0.2 /100 | #275 | Tragic 93.8% |
| West Indians | 0.2 /100 | #276 | Tragic 93.7% |
| Immigrants | Philippines | 0.1 /100 | #277 | Tragic 93.7% |
| Immigrants | Eritrea | 0.1 /100 | #278 | Tragic 93.7% |
| Trinidadians and Tobagonians | 0.1 /100 | #279 | Tragic 93.7% |
| Taiwanese | 0.1 /100 | #280 | Tragic 93.6% |
| Immigrants | Trinidad and Tobago | 0.1 /100 | #281 | Tragic 93.6% |
| Malaysians | 0.0 /100 | #282 | Tragic 93.5% |
| Barbadians | 0.0 /100 | #283 | Tragic 93.5% |
Demographics Similar to Panamanians by 9th Grade
In terms of 9th grade, the demographic groups most similar to Panamanians are Immigrants from Northern Africa (94.7%, a difference of 0.010%), Paraguayan (94.7%, a difference of 0.010%), Marshallese (94.7%, a difference of 0.010%), Immigrants from Lebanon (94.7%, a difference of 0.020%), and Sudanese (94.7%, a difference of 0.030%).
| Demographics | Rating | Rank | 9th Grade |
| Guamanians/Chamorros | 35.5 /100 | #187 | Fair 94.8% |
| Immigrants | Albania | 34.5 /100 | #188 | Fair 94.8% |
| Immigrants | Argentina | 34.4 /100 | #189 | Fair 94.8% |
| Sudanese | 32.7 /100 | #190 | Fair 94.7% |
| Assyrians/Chaldeans/Syriacs | 32.0 /100 | #191 | Fair 94.7% |
| Immigrants | Northern Africa | 30.7 /100 | #192 | Fair 94.7% |
| Paraguayans | 30.1 /100 | #193 | Fair 94.7% |
| Panamanians | 29.0 /100 | #194 | Fair 94.7% |
| Marshallese | 27.9 /100 | #195 | Fair 94.7% |
| Immigrants | Lebanon | 27.2 /100 | #196 | Fair 94.7% |
| Immigrants | Micronesia | 24.7 /100 | #197 | Fair 94.7% |
| Hawaiians | 22.7 /100 | #198 | Fair 94.7% |
| Laotians | 21.0 /100 | #199 | Fair 94.6% |
| Immigrants | Zaire | 20.6 /100 | #200 | Fair 94.6% |
| Blacks/African Americans | 20.5 /100 | #201 | Fair 94.6% |