Korean vs Immigrants from Philippines 6th Grade
COMPARE
Korean
Immigrants from Philippines
6th Grade
6th Grade Comparison
Koreans
Immigrants from Philippines
96.6%
6TH GRADE
1.9/ 100
METRIC RATING
240th/ 347
METRIC RANK
96.3%
6TH GRADE
0.1/ 100
METRIC RATING
274th/ 347
METRIC RANK
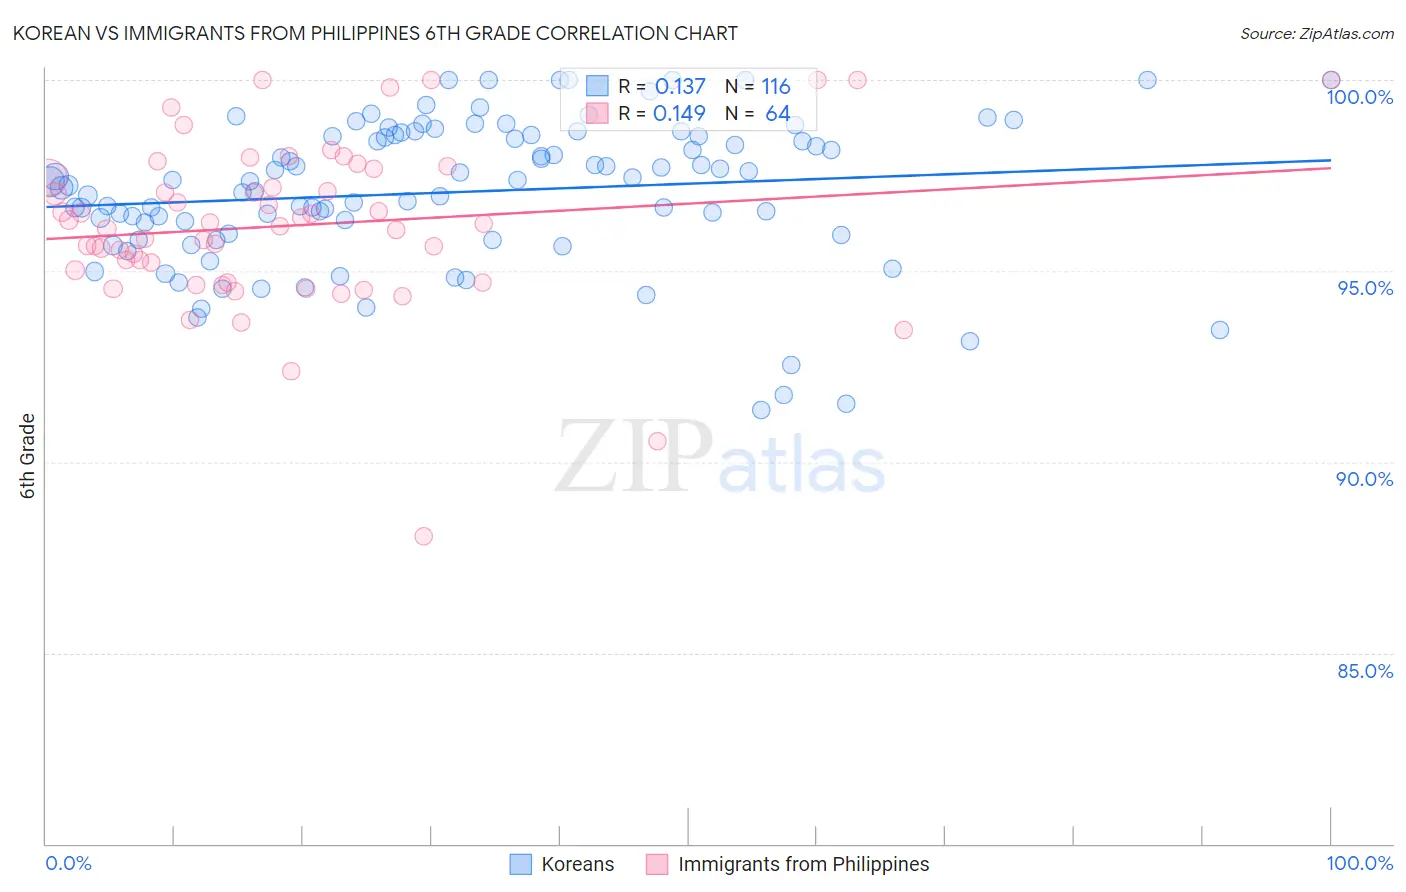
Korean vs Immigrants from Philippines 6th Grade Correlation Chart
The statistical analysis conducted on geographies consisting of 510,946,939 people shows a poor positive correlation between the proportion of Koreans and percentage of population with at least 6th grade education in the United States with a correlation coefficient (R) of 0.137 and weighted average of 96.6%. Similarly, the statistical analysis conducted on geographies consisting of 471,303,531 people shows a poor positive correlation between the proportion of Immigrants from Philippines and percentage of population with at least 6th grade education in the United States with a correlation coefficient (R) of 0.149 and weighted average of 96.3%, a difference of 0.33%.
6th Grade Correlation Summary
| Measurement | Korean | Immigrants from Philippines |
| Minimum | 91.4% | 88.1% |
| Maximum | 100.0% | 100.0% |
| Range | 8.6% | 11.9% |
| Mean | 97.1% | 96.2% |
| Median | 97.3% | 96.2% |
| Interquartile 25% (IQ1) | 95.9% | 94.9% |
| Interquartile 75% (IQ3) | 98.5% | 97.6% |
| Interquartile Range (IQR) | 2.6% | 2.7% |
| Standard Deviation (Sample) | 1.9% | 2.2% |
| Standard Deviation (Population) | 1.9% | 2.2% |
Similar Demographics by 6th Grade
Demographics Similar to Koreans by 6th Grade
In terms of 6th grade, the demographic groups most similar to Koreans are Nigerian (96.6%, a difference of 0.0%), Indian (Asian) (96.6%, a difference of 0.0%), Senegalese (96.6%, a difference of 0.0%), Immigrants from Eastern Africa (96.6%, a difference of 0.010%), and Immigrants from Asia (96.6%, a difference of 0.010%).
| Demographics | Rating | Rank | 6th Grade |
| Yuman | 3.2 /100 | #233 | Tragic 96.7% |
| Uruguayans | 2.5 /100 | #234 | Tragic 96.6% |
| Asians | 2.4 /100 | #235 | Tragic 96.6% |
| Immigrants | Indonesia | 2.3 /100 | #236 | Tragic 96.6% |
| Immigrants | Eastern Africa | 2.0 /100 | #237 | Tragic 96.6% |
| Nigerians | 1.9 /100 | #238 | Tragic 96.6% |
| Indians (Asian) | 1.9 /100 | #239 | Tragic 96.6% |
| Koreans | 1.9 /100 | #240 | Tragic 96.6% |
| Senegalese | 1.8 /100 | #241 | Tragic 96.6% |
| Immigrants | Asia | 1.8 /100 | #242 | Tragic 96.6% |
| Immigrants | Liberia | 1.6 /100 | #243 | Tragic 96.6% |
| Ethiopians | 1.5 /100 | #244 | Tragic 96.6% |
| Immigrants | Costa Rica | 1.3 /100 | #245 | Tragic 96.6% |
| Immigrants | Africa | 1.3 /100 | #246 | Tragic 96.6% |
| Bolivians | 1.0 /100 | #247 | Tragic 96.5% |
Demographics Similar to Immigrants from Philippines by 6th Grade
In terms of 6th grade, the demographic groups most similar to Immigrants from Philippines are Immigrants from Cameroon (96.3%, a difference of 0.0%), Immigrants from Bolivia (96.3%, a difference of 0.010%), Immigrants from Ghana (96.3%, a difference of 0.010%), Yaqui (96.3%, a difference of 0.020%), and Immigrants from Western Africa (96.3%, a difference of 0.030%).
| Demographics | Rating | Rank | 6th Grade |
| Afghans | 0.2 /100 | #267 | Tragic 96.4% |
| Immigrants | Uzbekistan | 0.2 /100 | #268 | Tragic 96.3% |
| West Indians | 0.2 /100 | #269 | Tragic 96.3% |
| Immigrants | South America | 0.2 /100 | #270 | Tragic 96.3% |
| Immigrants | Hong Kong | 0.2 /100 | #271 | Tragic 96.3% |
| Immigrants | Bolivia | 0.1 /100 | #272 | Tragic 96.3% |
| Immigrants | Cameroon | 0.1 /100 | #273 | Tragic 96.3% |
| Immigrants | Philippines | 0.1 /100 | #274 | Tragic 96.3% |
| Immigrants | Ghana | 0.1 /100 | #275 | Tragic 96.3% |
| Yaqui | 0.1 /100 | #276 | Tragic 96.3% |
| Immigrants | Western Africa | 0.1 /100 | #277 | Tragic 96.3% |
| Immigrants | Thailand | 0.1 /100 | #278 | Tragic 96.3% |
| Immigrants | Peru | 0.1 /100 | #279 | Tragic 96.2% |
| Immigrants | Afghanistan | 0.1 /100 | #280 | Tragic 96.2% |
| Trinidadians and Tobagonians | 0.1 /100 | #281 | Tragic 96.2% |