Kiowa vs Immigrants from Indonesia Professional Degree
COMPARE
Kiowa
Immigrants from Indonesia
Professional Degree
Professional Degree Comparison
Kiowa
Immigrants from Indonesia
3.1%
PROFESSIONAL DEGREE
0.0/ 100
METRIC RATING
331st/ 347
METRIC RANK
5.3%
PROFESSIONAL DEGREE
99.7/ 100
METRIC RATING
75th/ 347
METRIC RANK
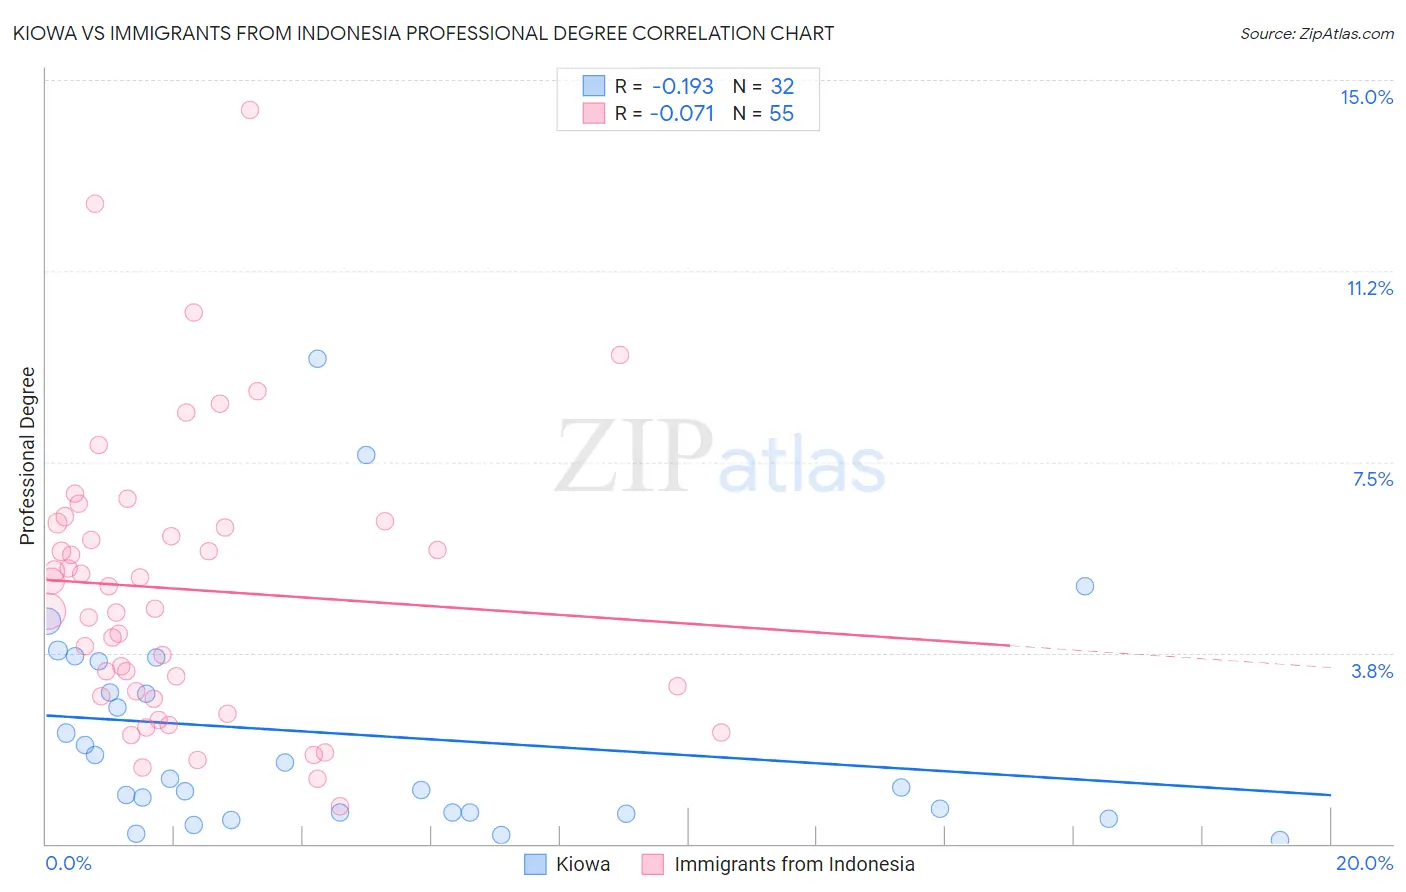
Kiowa vs Immigrants from Indonesia Professional Degree Correlation Chart
The statistical analysis conducted on geographies consisting of 56,015,287 people shows a poor negative correlation between the proportion of Kiowa and percentage of population with at least professional degree education in the United States with a correlation coefficient (R) of -0.193 and weighted average of 3.1%. Similarly, the statistical analysis conducted on geographies consisting of 215,647,199 people shows a slight negative correlation between the proportion of Immigrants from Indonesia and percentage of population with at least professional degree education in the United States with a correlation coefficient (R) of -0.071 and weighted average of 5.3%, a difference of 73.5%.
Professional Degree Correlation Summary
| Measurement | Kiowa | Immigrants from Indonesia |
| Minimum | 0.082% | 0.73% |
| Maximum | 9.5% | 14.4% |
| Range | 9.4% | 13.7% |
| Mean | 2.1% | 5.0% |
| Median | 1.2% | 4.6% |
| Interquartile 25% (IQ1) | 0.60% | 2.9% |
| Interquartile 75% (IQ3) | 3.3% | 6.3% |
| Interquartile Range (IQR) | 2.7% | 3.4% |
| Standard Deviation (Sample) | 2.2% | 2.8% |
| Standard Deviation (Population) | 2.2% | 2.8% |
Similar Demographics by Professional Degree
Demographics Similar to Kiowa by Professional Degree
In terms of professional degree, the demographic groups most similar to Kiowa are Yakama (3.1%, a difference of 0.11%), Immigrants from Cabo Verde (3.1%, a difference of 0.12%), Puget Sound Salish (3.1%, a difference of 0.14%), Bangladeshi (3.1%, a difference of 0.20%), and Creek (3.1%, a difference of 0.41%).
| Demographics | Rating | Rank | Professional Degree |
| Crow | 0.0 /100 | #324 | Tragic 3.2% |
| Yaqui | 0.0 /100 | #325 | Tragic 3.2% |
| Menominee | 0.0 /100 | #326 | Tragic 3.1% |
| Dutch West Indians | 0.0 /100 | #327 | Tragic 3.1% |
| Creek | 0.0 /100 | #328 | Tragic 3.1% |
| Bangladeshis | 0.0 /100 | #329 | Tragic 3.1% |
| Immigrants | Cabo Verde | 0.0 /100 | #330 | Tragic 3.1% |
| Kiowa | 0.0 /100 | #331 | Tragic 3.1% |
| Yakama | 0.0 /100 | #332 | Tragic 3.1% |
| Puget Sound Salish | 0.0 /100 | #333 | Tragic 3.1% |
| Pennsylvania Germans | 0.0 /100 | #334 | Tragic 3.0% |
| Natives/Alaskans | 0.0 /100 | #335 | Tragic 3.0% |
| Fijians | 0.0 /100 | #336 | Tragic 2.9% |
| Arapaho | 0.0 /100 | #337 | Tragic 2.9% |
| Navajo | 0.0 /100 | #338 | Tragic 2.9% |
Demographics Similar to Immigrants from Indonesia by Professional Degree
In terms of professional degree, the demographic groups most similar to Immigrants from Indonesia are Immigrants from Canada (5.3%, a difference of 0.090%), Ethiopian (5.4%, a difference of 0.13%), Immigrants from Ethiopia (5.3%, a difference of 0.13%), Armenian (5.3%, a difference of 0.17%), and Immigrants from North America (5.3%, a difference of 0.35%).
| Demographics | Rating | Rank | Professional Degree |
| Immigrants | Lebanon | 99.9 /100 | #68 | Exceptional 5.5% |
| Immigrants | Hungary | 99.9 /100 | #69 | Exceptional 5.5% |
| Bhutanese | 99.8 /100 | #70 | Exceptional 5.4% |
| Immigrants | Western Asia | 99.8 /100 | #71 | Exceptional 5.4% |
| Lithuanians | 99.8 /100 | #72 | Exceptional 5.4% |
| Immigrants | Romania | 99.8 /100 | #73 | Exceptional 5.4% |
| Ethiopians | 99.7 /100 | #74 | Exceptional 5.4% |
| Immigrants | Indonesia | 99.7 /100 | #75 | Exceptional 5.3% |
| Immigrants | Canada | 99.7 /100 | #76 | Exceptional 5.3% |
| Immigrants | Ethiopia | 99.7 /100 | #77 | Exceptional 5.3% |
| Armenians | 99.7 /100 | #78 | Exceptional 5.3% |
| Immigrants | North America | 99.7 /100 | #79 | Exceptional 5.3% |
| Immigrants | England | 99.6 /100 | #80 | Exceptional 5.3% |
| Immigrants | Brazil | 99.6 /100 | #81 | Exceptional 5.3% |
| Romanians | 99.6 /100 | #82 | Exceptional 5.3% |