South African vs Immigrants from Dominica Professional Degree
COMPARE
South African
Immigrants from Dominica
Professional Degree
Professional Degree Comparison
South Africans
Immigrants from Dominica
5.7%
PROFESSIONAL DEGREE
100.0/ 100
METRIC RATING
57th/ 347
METRIC RANK
3.6%
PROFESSIONAL DEGREE
0.5/ 100
METRIC RATING
275th/ 347
METRIC RANK
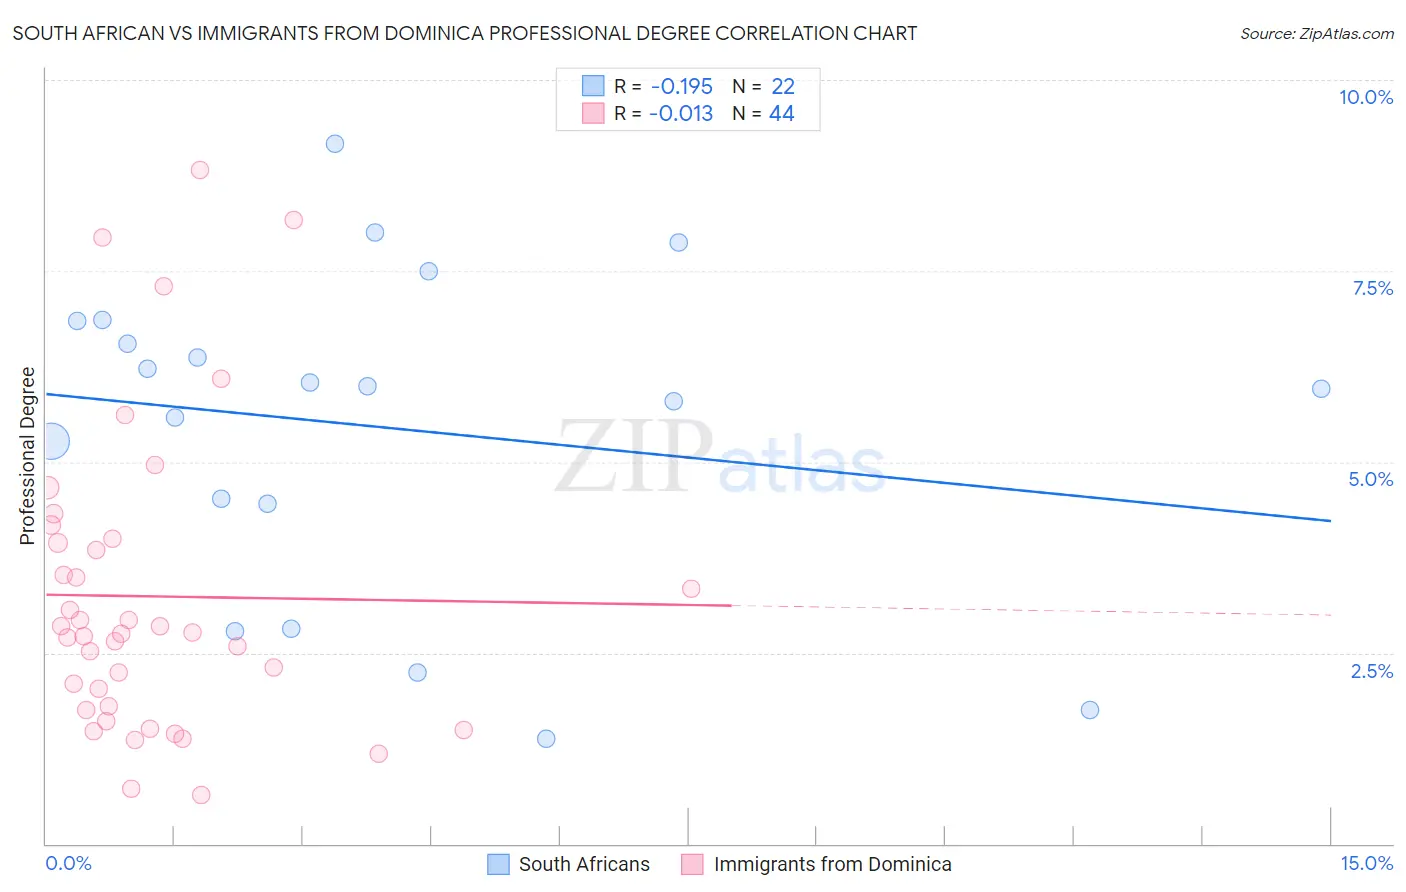
South African vs Immigrants from Dominica Professional Degree Correlation Chart
The statistical analysis conducted on geographies consisting of 182,499,194 people shows a poor negative correlation between the proportion of South Africans and percentage of population with at least professional degree education in the United States with a correlation coefficient (R) of -0.195 and weighted average of 5.7%. Similarly, the statistical analysis conducted on geographies consisting of 83,774,697 people shows no correlation between the proportion of Immigrants from Dominica and percentage of population with at least professional degree education in the United States with a correlation coefficient (R) of -0.013 and weighted average of 3.6%, a difference of 60.4%.
Professional Degree Correlation Summary
| Measurement | South African | Immigrants from Dominica |
| Minimum | 1.4% | 0.64% |
| Maximum | 9.2% | 8.8% |
| Range | 7.8% | 8.2% |
| Mean | 5.5% | 3.2% |
| Median | 6.0% | 2.8% |
| Interquartile 25% (IQ1) | 4.5% | 1.8% |
| Interquartile 75% (IQ3) | 6.8% | 4.0% |
| Interquartile Range (IQR) | 2.4% | 2.2% |
| Standard Deviation (Sample) | 2.1% | 2.0% |
| Standard Deviation (Population) | 2.1% | 2.0% |
Similar Demographics by Professional Degree
Demographics Similar to South Africans by Professional Degree
In terms of professional degree, the demographic groups most similar to South Africans are Immigrants from Malaysia (5.7%, a difference of 0.26%), Immigrants from Western Europe (5.7%, a difference of 0.38%), Bulgarian (5.7%, a difference of 0.59%), Immigrants from Kuwait (5.7%, a difference of 0.79%), and Immigrants from Europe (5.6%, a difference of 1.1%).
| Demographics | Rating | Rank | Professional Degree |
| Immigrants | Czechoslovakia | 100.0 /100 | #50 | Exceptional 5.8% |
| Immigrants | Greece | 100.0 /100 | #51 | Exceptional 5.8% |
| Immigrants | Serbia | 100.0 /100 | #52 | Exceptional 5.8% |
| Immigrants | Netherlands | 100.0 /100 | #53 | Exceptional 5.8% |
| Immigrants | Kuwait | 100.0 /100 | #54 | Exceptional 5.7% |
| Immigrants | Western Europe | 100.0 /100 | #55 | Exceptional 5.7% |
| Immigrants | Malaysia | 100.0 /100 | #56 | Exceptional 5.7% |
| South Africans | 100.0 /100 | #57 | Exceptional 5.7% |
| Bulgarians | 100.0 /100 | #58 | Exceptional 5.7% |
| Immigrants | Europe | 100.0 /100 | #59 | Exceptional 5.6% |
| Bolivians | 99.9 /100 | #60 | Exceptional 5.6% |
| Immigrants | Lithuania | 99.9 /100 | #61 | Exceptional 5.6% |
| Immigrants | Belarus | 99.9 /100 | #62 | Exceptional 5.5% |
| Asians | 99.9 /100 | #63 | Exceptional 5.5% |
| Immigrants | Asia | 99.9 /100 | #64 | Exceptional 5.5% |
Demographics Similar to Immigrants from Dominica by Professional Degree
In terms of professional degree, the demographic groups most similar to Immigrants from Dominica are Liberian (3.6%, a difference of 0.050%), Cheyenne (3.6%, a difference of 0.060%), Japanese (3.5%, a difference of 0.12%), Immigrants from Portugal (3.5%, a difference of 0.16%), and Dominican (3.5%, a difference of 0.20%).
| Demographics | Rating | Rank | Professional Degree |
| Aleuts | 0.7 /100 | #268 | Tragic 3.6% |
| Immigrants | Cuba | 0.6 /100 | #269 | Tragic 3.6% |
| Central Americans | 0.6 /100 | #270 | Tragic 3.6% |
| Belizeans | 0.5 /100 | #271 | Tragic 3.6% |
| Immigrants | Jamaica | 0.5 /100 | #272 | Tragic 3.6% |
| Americans | 0.5 /100 | #273 | Tragic 3.6% |
| Potawatomi | 0.5 /100 | #274 | Tragic 3.6% |
| Immigrants | Dominica | 0.5 /100 | #275 | Tragic 3.6% |
| Liberians | 0.5 /100 | #276 | Tragic 3.6% |
| Cheyenne | 0.5 /100 | #277 | Tragic 3.6% |
| Japanese | 0.5 /100 | #278 | Tragic 3.5% |
| Immigrants | Portugal | 0.5 /100 | #279 | Tragic 3.5% |
| Dominicans | 0.5 /100 | #280 | Tragic 3.5% |
| Apache | 0.5 /100 | #281 | Tragic 3.5% |
| Immigrants | Caribbean | 0.5 /100 | #282 | Tragic 3.5% |