Immigrants from Chile vs Immigrants from Dominica Professional Degree
COMPARE
Immigrants from Chile
Immigrants from Dominica
Professional Degree
Professional Degree Comparison
Immigrants from Chile
Immigrants from Dominica
5.3%
PROFESSIONAL DEGREE
99.5/ 100
METRIC RATING
87th/ 347
METRIC RANK
3.6%
PROFESSIONAL DEGREE
0.5/ 100
METRIC RATING
275th/ 347
METRIC RANK
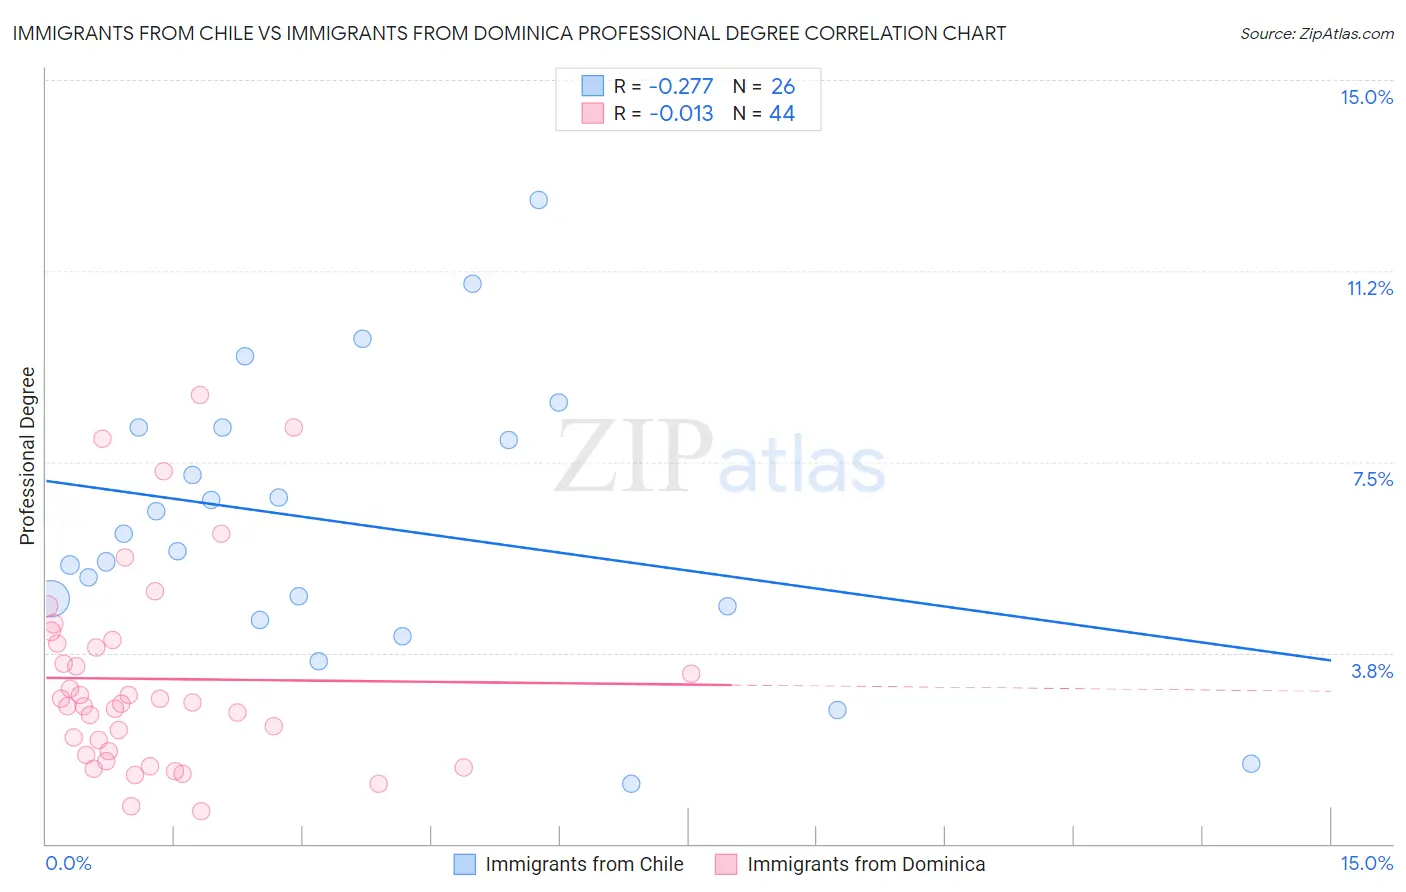
Immigrants from Chile vs Immigrants from Dominica Professional Degree Correlation Chart
The statistical analysis conducted on geographies consisting of 218,541,106 people shows a weak negative correlation between the proportion of Immigrants from Chile and percentage of population with at least professional degree education in the United States with a correlation coefficient (R) of -0.277 and weighted average of 5.3%. Similarly, the statistical analysis conducted on geographies consisting of 83,774,697 people shows no correlation between the proportion of Immigrants from Dominica and percentage of population with at least professional degree education in the United States with a correlation coefficient (R) of -0.013 and weighted average of 3.6%, a difference of 48.2%.
Professional Degree Correlation Summary
| Measurement | Immigrants from Chile | Immigrants from Dominica |
| Minimum | 1.2% | 0.64% |
| Maximum | 12.6% | 8.8% |
| Range | 11.5% | 8.2% |
| Mean | 6.3% | 3.2% |
| Median | 5.9% | 2.8% |
| Interquartile 25% (IQ1) | 4.7% | 1.8% |
| Interquartile 75% (IQ3) | 8.2% | 4.0% |
| Interquartile Range (IQR) | 3.5% | 2.2% |
| Standard Deviation (Sample) | 2.8% | 2.0% |
| Standard Deviation (Population) | 2.7% | 2.0% |
Similar Demographics by Professional Degree
Demographics Similar to Immigrants from Chile by Professional Degree
In terms of professional degree, the demographic groups most similar to Immigrants from Chile are Immigrants from Zimbabwe (5.3%, a difference of 0.11%), Greek (5.3%, a difference of 0.11%), Carpatho Rusyn (5.3%, a difference of 0.13%), Immigrants from Croatia (5.3%, a difference of 0.13%), and Egyptian (5.3%, a difference of 0.14%).
| Demographics | Rating | Rank | Professional Degree |
| Immigrants | England | 99.6 /100 | #80 | Exceptional 5.3% |
| Immigrants | Brazil | 99.6 /100 | #81 | Exceptional 5.3% |
| Romanians | 99.6 /100 | #82 | Exceptional 5.3% |
| Carpatho Rusyns | 99.6 /100 | #83 | Exceptional 5.3% |
| Immigrants | Croatia | 99.6 /100 | #84 | Exceptional 5.3% |
| Immigrants | Zimbabwe | 99.6 /100 | #85 | Exceptional 5.3% |
| Greeks | 99.6 /100 | #86 | Exceptional 5.3% |
| Immigrants | Chile | 99.5 /100 | #87 | Exceptional 5.3% |
| Egyptians | 99.5 /100 | #88 | Exceptional 5.3% |
| Chileans | 99.5 /100 | #89 | Exceptional 5.3% |
| Immigrants | Scotland | 99.5 /100 | #90 | Exceptional 5.3% |
| Laotians | 99.5 /100 | #91 | Exceptional 5.2% |
| Immigrants | Eastern Europe | 99.5 /100 | #92 | Exceptional 5.2% |
| Northern Europeans | 99.3 /100 | #93 | Exceptional 5.2% |
| Alsatians | 99.3 /100 | #94 | Exceptional 5.2% |
Demographics Similar to Immigrants from Dominica by Professional Degree
In terms of professional degree, the demographic groups most similar to Immigrants from Dominica are Liberian (3.6%, a difference of 0.050%), Cheyenne (3.6%, a difference of 0.060%), Japanese (3.5%, a difference of 0.12%), Immigrants from Portugal (3.5%, a difference of 0.16%), and Dominican (3.5%, a difference of 0.20%).
| Demographics | Rating | Rank | Professional Degree |
| Aleuts | 0.7 /100 | #268 | Tragic 3.6% |
| Immigrants | Cuba | 0.6 /100 | #269 | Tragic 3.6% |
| Central Americans | 0.6 /100 | #270 | Tragic 3.6% |
| Belizeans | 0.5 /100 | #271 | Tragic 3.6% |
| Immigrants | Jamaica | 0.5 /100 | #272 | Tragic 3.6% |
| Americans | 0.5 /100 | #273 | Tragic 3.6% |
| Potawatomi | 0.5 /100 | #274 | Tragic 3.6% |
| Immigrants | Dominica | 0.5 /100 | #275 | Tragic 3.6% |
| Liberians | 0.5 /100 | #276 | Tragic 3.6% |
| Cheyenne | 0.5 /100 | #277 | Tragic 3.6% |
| Japanese | 0.5 /100 | #278 | Tragic 3.5% |
| Immigrants | Portugal | 0.5 /100 | #279 | Tragic 3.5% |
| Dominicans | 0.5 /100 | #280 | Tragic 3.5% |
| Apache | 0.5 /100 | #281 | Tragic 3.5% |
| Immigrants | Caribbean | 0.5 /100 | #282 | Tragic 3.5% |