Kiowa vs Immigrants from Serbia No Schooling Completed
COMPARE
Kiowa
Immigrants from Serbia
No Schooling Completed
No Schooling Completed Comparison
Kiowa
Immigrants from Serbia
1.6%
NO SCHOOLING COMPLETED
99.8/ 100
METRIC RATING
58th/ 347
METRIC RANK
1.9%
NO SCHOOLING COMPLETED
95.8/ 100
METRIC RATING
117th/ 347
METRIC RANK
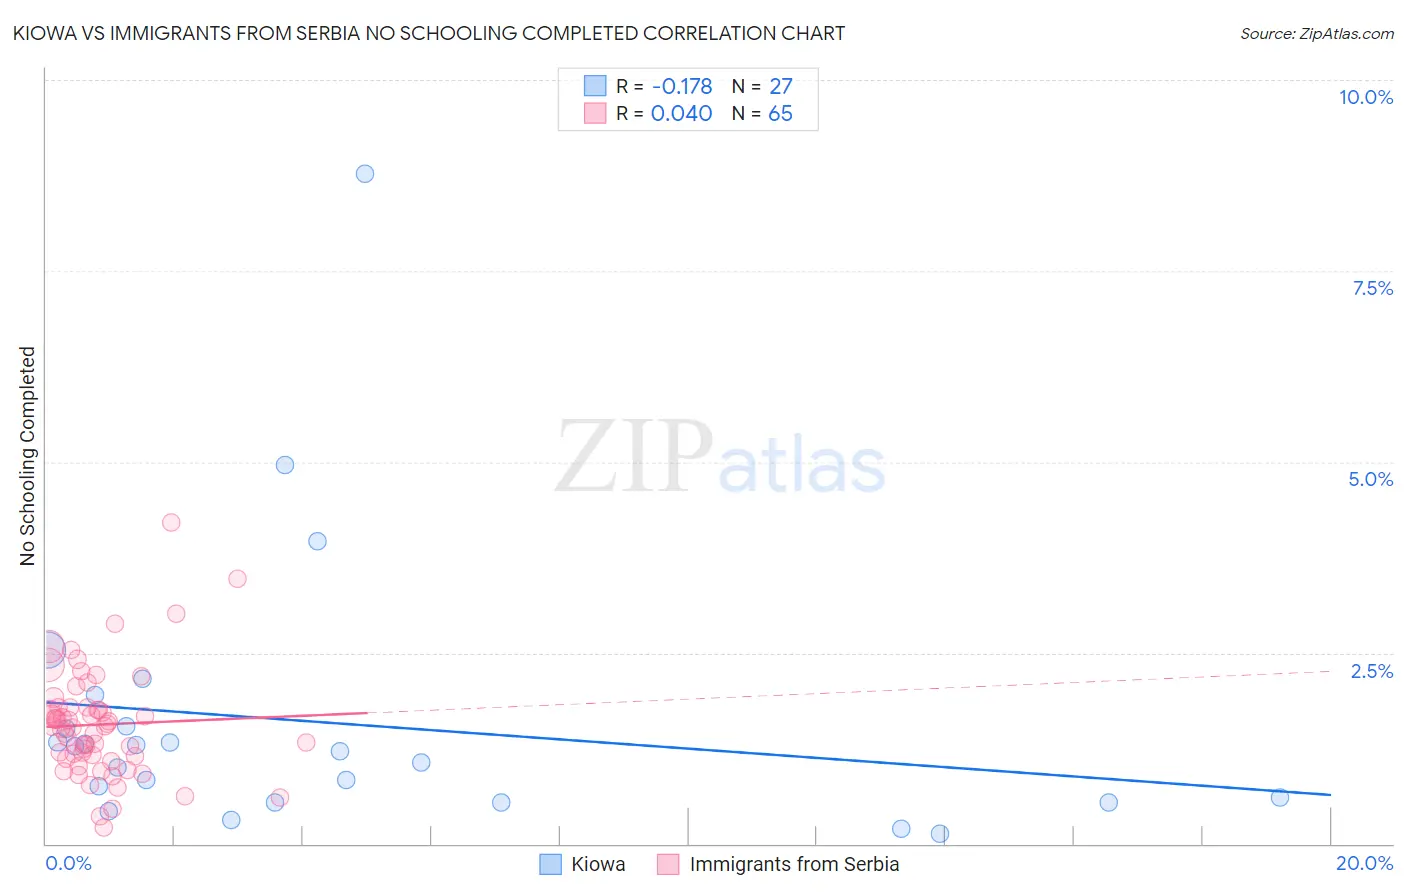
Kiowa vs Immigrants from Serbia No Schooling Completed Correlation Chart
The statistical analysis conducted on geographies consisting of 55,891,433 people shows a poor negative correlation between the proportion of Kiowa and percentage of population with no schooling in the United States with a correlation coefficient (R) of -0.178 and weighted average of 1.6%. Similarly, the statistical analysis conducted on geographies consisting of 131,329,769 people shows no correlation between the proportion of Immigrants from Serbia and percentage of population with no schooling in the United States with a correlation coefficient (R) of 0.040 and weighted average of 1.9%, a difference of 13.5%.
No Schooling Completed Correlation Summary
| Measurement | Kiowa | Immigrants from Serbia |
| Minimum | 0.13% | 0.22% |
| Maximum | 8.8% | 4.2% |
| Range | 8.6% | 4.0% |
| Mean | 1.6% | 1.6% |
| Median | 1.2% | 1.5% |
| Interquartile 25% (IQ1) | 0.55% | 1.1% |
| Interquartile 75% (IQ3) | 1.5% | 1.8% |
| Interquartile Range (IQR) | 0.99% | 0.66% |
| Standard Deviation (Sample) | 1.8% | 0.71% |
| Standard Deviation (Population) | 1.8% | 0.70% |
Similar Demographics by No Schooling Completed
Demographics Similar to Kiowa by No Schooling Completed
In terms of no schooling completed, the demographic groups most similar to Kiowa are Slavic (1.7%, a difference of 0.070%), Austrian (1.6%, a difference of 0.16%), American (1.7%, a difference of 0.19%), Immigrants from North America (1.6%, a difference of 0.46%), and Greek (1.6%, a difference of 0.47%).
| Demographics | Rating | Rank | No Schooling Completed |
| Chippewa | 99.8 /100 | #51 | Exceptional 1.6% |
| Immigrants | Canada | 99.8 /100 | #52 | Exceptional 1.6% |
| Creek | 99.8 /100 | #53 | Exceptional 1.6% |
| Crow | 99.8 /100 | #54 | Exceptional 1.6% |
| Greeks | 99.8 /100 | #55 | Exceptional 1.6% |
| Immigrants | North America | 99.8 /100 | #56 | Exceptional 1.6% |
| Austrians | 99.8 /100 | #57 | Exceptional 1.6% |
| Kiowa | 99.8 /100 | #58 | Exceptional 1.6% |
| Slavs | 99.8 /100 | #59 | Exceptional 1.7% |
| Americans | 99.8 /100 | #60 | Exceptional 1.7% |
| Tsimshian | 99.8 /100 | #61 | Exceptional 1.7% |
| Immigrants | Northern Europe | 99.8 /100 | #62 | Exceptional 1.7% |
| Russians | 99.8 /100 | #63 | Exceptional 1.7% |
| New Zealanders | 99.7 /100 | #64 | Exceptional 1.7% |
| Serbians | 99.7 /100 | #65 | Exceptional 1.7% |
Demographics Similar to Immigrants from Serbia by No Schooling Completed
In terms of no schooling completed, the demographic groups most similar to Immigrants from Serbia are Lebanese (1.9%, a difference of 0.20%), Syrian (1.9%, a difference of 0.22%), Spanish (1.9%, a difference of 0.24%), Immigrants from Norway (1.9%, a difference of 0.35%), and Immigrants from Zimbabwe (1.9%, a difference of 0.36%).
| Demographics | Rating | Rank | No Schooling Completed |
| Immigrants | Latvia | 96.7 /100 | #110 | Exceptional 1.9% |
| Immigrants | Japan | 96.6 /100 | #111 | Exceptional 1.9% |
| Pueblo | 96.4 /100 | #112 | Exceptional 1.9% |
| Immigrants | Zimbabwe | 96.2 /100 | #113 | Exceptional 1.9% |
| Immigrants | Norway | 96.1 /100 | #114 | Exceptional 1.9% |
| Syrians | 96.0 /100 | #115 | Exceptional 1.9% |
| Lebanese | 96.0 /100 | #116 | Exceptional 1.9% |
| Immigrants | Serbia | 95.8 /100 | #117 | Exceptional 1.9% |
| Spanish | 95.5 /100 | #118 | Exceptional 1.9% |
| Iroquois | 95.1 /100 | #119 | Exceptional 1.9% |
| Immigrants | Bulgaria | 94.6 /100 | #120 | Exceptional 1.9% |
| Immigrants | Croatia | 94.5 /100 | #121 | Exceptional 1.9% |
| Cree | 94.5 /100 | #122 | Exceptional 1.9% |
| Immigrants | Kuwait | 93.9 /100 | #123 | Exceptional 1.9% |
| Cambodians | 93.8 /100 | #124 | Exceptional 1.9% |