Immigrants from Mexico vs Immigrants from Turkey 3rd Grade
COMPARE
Immigrants from Mexico
Immigrants from Turkey
3rd Grade
3rd Grade Comparison
Immigrants from Mexico
Immigrants from Turkey
95.8%
3RD GRADE
0.0/ 100
METRIC RATING
343rd/ 347
METRIC RANK
97.9%
3RD GRADE
83.5/ 100
METRIC RATING
141st/ 347
METRIC RANK
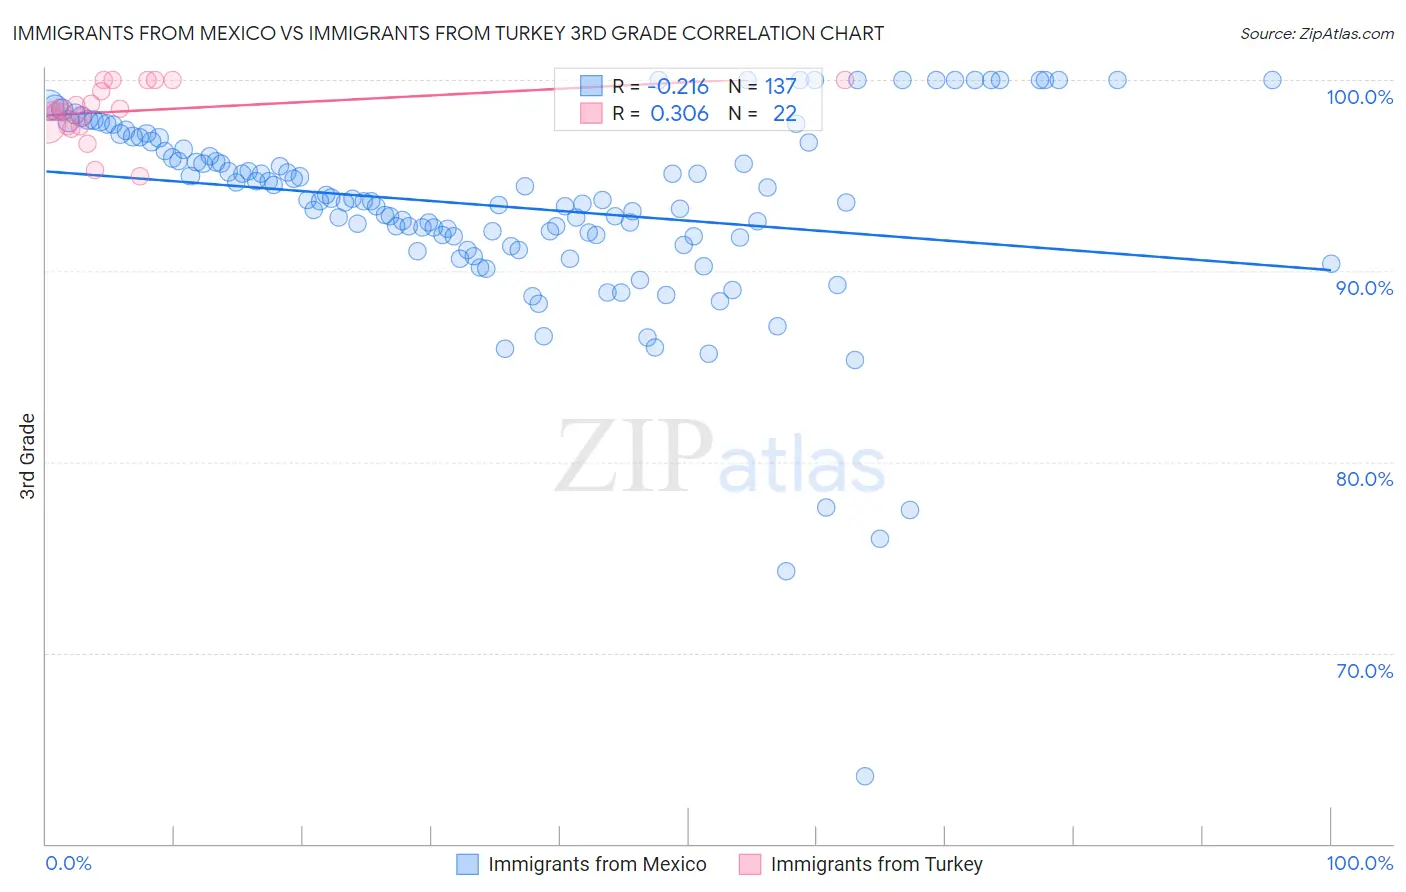
Immigrants from Mexico vs Immigrants from Turkey 3rd Grade Correlation Chart
The statistical analysis conducted on geographies consisting of 513,767,657 people shows a weak negative correlation between the proportion of Immigrants from Mexico and percentage of population with at least 3rd grade education in the United States with a correlation coefficient (R) of -0.216 and weighted average of 95.8%. Similarly, the statistical analysis conducted on geographies consisting of 223,057,877 people shows a mild positive correlation between the proportion of Immigrants from Turkey and percentage of population with at least 3rd grade education in the United States with a correlation coefficient (R) of 0.306 and weighted average of 97.9%, a difference of 2.2%.
3rd Grade Correlation Summary
| Measurement | Immigrants from Mexico | Immigrants from Turkey |
| Minimum | 63.5% | 95.0% |
| Maximum | 100.0% | 100.0% |
| Range | 36.5% | 5.0% |
| Mean | 93.4% | 98.4% |
| Median | 93.7% | 98.4% |
| Interquartile 25% (IQ1) | 91.8% | 97.6% |
| Interquartile 75% (IQ3) | 96.9% | 100.0% |
| Interquartile Range (IQR) | 5.1% | 2.4% |
| Standard Deviation (Sample) | 5.4% | 1.4% |
| Standard Deviation (Population) | 5.3% | 1.4% |
Similar Demographics by 3rd Grade
Demographics Similar to Immigrants from Mexico by 3rd Grade
In terms of 3rd grade, the demographic groups most similar to Immigrants from Mexico are Immigrants from Central America (95.8%, a difference of 0.040%), Immigrants from Guatemala (95.8%, a difference of 0.040%), Nepalese (95.9%, a difference of 0.090%), Salvadoran (95.7%, a difference of 0.11%), and Yakama (95.9%, a difference of 0.17%).
| Demographics | Rating | Rank | 3rd Grade |
| Immigrants | Fiji | 0.0 /100 | #333 | Tragic 96.2% |
| Immigrants | Cambodia | 0.0 /100 | #334 | Tragic 96.2% |
| Immigrants | Dominican Republic | 0.0 /100 | #335 | Tragic 96.2% |
| Immigrants | Cabo Verde | 0.0 /100 | #336 | Tragic 96.2% |
| Central Americans | 0.0 /100 | #337 | Tragic 96.1% |
| Guatemalans | 0.0 /100 | #338 | Tragic 96.0% |
| Yakama | 0.0 /100 | #339 | Tragic 95.9% |
| Nepalese | 0.0 /100 | #340 | Tragic 95.9% |
| Immigrants | Central America | 0.0 /100 | #341 | Tragic 95.8% |
| Immigrants | Guatemala | 0.0 /100 | #342 | Tragic 95.8% |
| Immigrants | Mexico | 0.0 /100 | #343 | Tragic 95.8% |
| Salvadorans | 0.0 /100 | #344 | Tragic 95.7% |
| Immigrants | Yemen | 0.0 /100 | #345 | Tragic 95.6% |
| Immigrants | El Salvador | 0.0 /100 | #346 | Tragic 95.5% |
| Spanish American Indians | 0.0 /100 | #347 | Tragic 95.3% |
Demographics Similar to Immigrants from Turkey by 3rd Grade
In terms of 3rd grade, the demographic groups most similar to Immigrants from Turkey are Palestinian (97.9%, a difference of 0.010%), Israeli (97.9%, a difference of 0.020%), Blackfeet (97.9%, a difference of 0.020%), Hmong (97.9%, a difference of 0.020%), and Filipino (97.9%, a difference of 0.020%).
| Demographics | Rating | Rank | 3rd Grade |
| Seminole | 88.7 /100 | #134 | Excellent 97.9% |
| Cambodians | 88.1 /100 | #135 | Excellent 97.9% |
| Spaniards | 87.9 /100 | #136 | Excellent 97.9% |
| Immigrants | Romania | 87.9 /100 | #137 | Excellent 97.9% |
| Israelis | 86.6 /100 | #138 | Excellent 97.9% |
| Blackfeet | 86.3 /100 | #139 | Excellent 97.9% |
| Palestinians | 84.6 /100 | #140 | Excellent 97.9% |
| Immigrants | Turkey | 83.5 /100 | #141 | Excellent 97.9% |
| Hmong | 80.3 /100 | #142 | Excellent 97.9% |
| Filipinos | 79.9 /100 | #143 | Good 97.9% |
| Burmese | 79.6 /100 | #144 | Good 97.9% |
| Immigrants | Greece | 79.5 /100 | #145 | Good 97.9% |
| Alsatians | 78.3 /100 | #146 | Good 97.9% |
| Immigrants | Israel | 77.3 /100 | #147 | Good 97.9% |
| Immigrants | Moldova | 77.1 /100 | #148 | Good 97.9% |