Nicaraguan vs Immigrants from Fiji 3rd Grade
COMPARE
Nicaraguan
Immigrants from Fiji
3rd Grade
3rd Grade Comparison
Nicaraguans
Immigrants from Fiji
96.7%
3RD GRADE
0.0/ 100
METRIC RATING
307th/ 347
METRIC RANK
96.2%
3RD GRADE
0.0/ 100
METRIC RATING
333rd/ 347
METRIC RANK
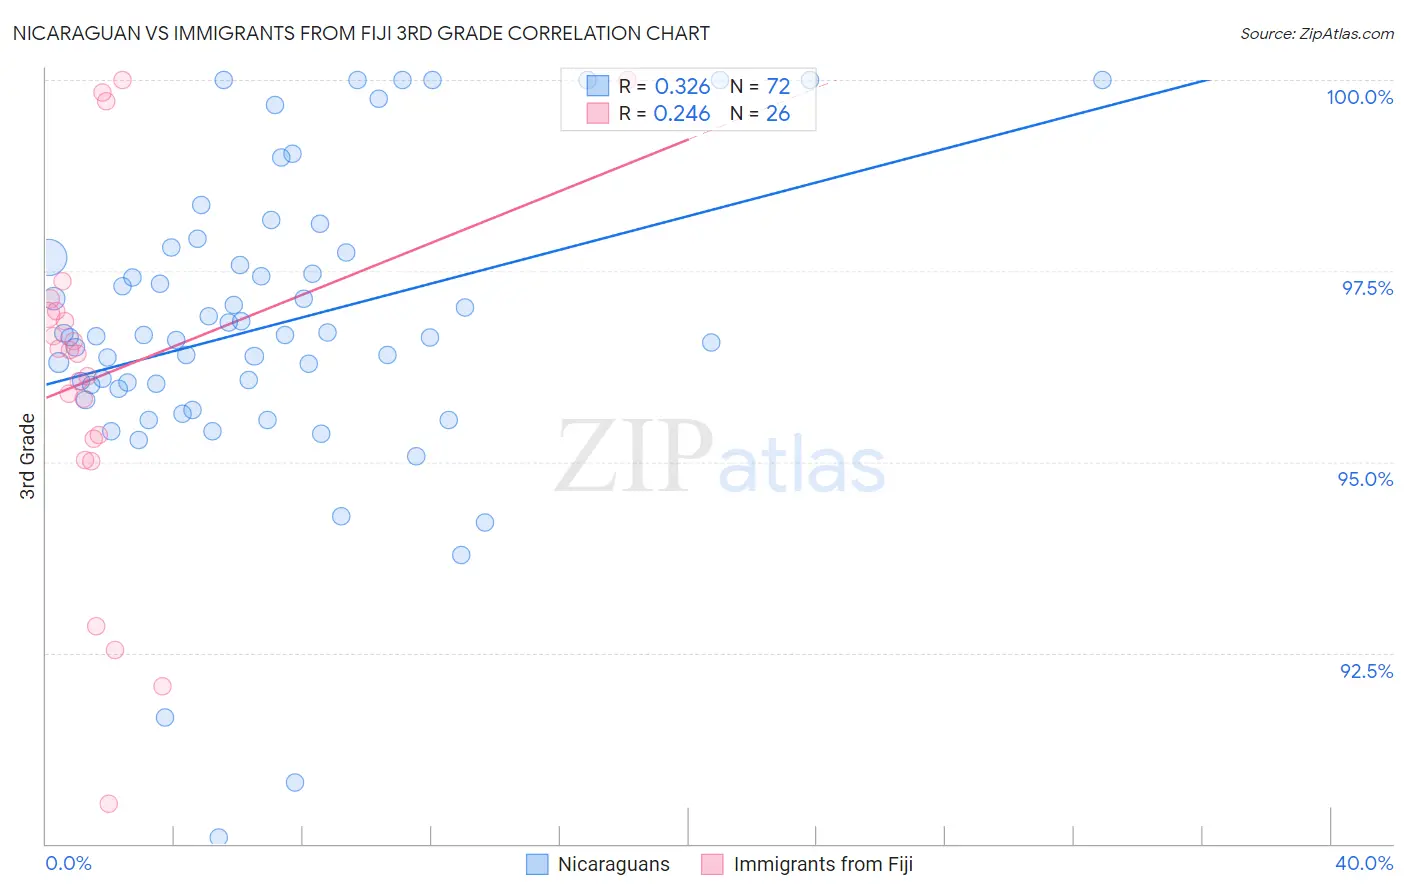
Nicaraguan vs Immigrants from Fiji 3rd Grade Correlation Chart
The statistical analysis conducted on geographies consisting of 285,711,389 people shows a mild positive correlation between the proportion of Nicaraguans and percentage of population with at least 3rd grade education in the United States with a correlation coefficient (R) of 0.326 and weighted average of 96.7%. Similarly, the statistical analysis conducted on geographies consisting of 93,756,204 people shows a weak positive correlation between the proportion of Immigrants from Fiji and percentage of population with at least 3rd grade education in the United States with a correlation coefficient (R) of 0.246 and weighted average of 96.2%, a difference of 0.49%.
3rd Grade Correlation Summary
| Measurement | Nicaraguan | Immigrants from Fiji |
| Minimum | 90.1% | 90.5% |
| Maximum | 100.0% | 100.0% |
| Range | 9.9% | 9.5% |
| Mean | 96.8% | 96.2% |
| Median | 96.7% | 96.4% |
| Interquartile 25% (IQ1) | 96.0% | 95.3% |
| Interquartile 75% (IQ3) | 97.7% | 97.0% |
| Interquartile Range (IQR) | 1.7% | 1.7% |
| Standard Deviation (Sample) | 2.0% | 2.3% |
| Standard Deviation (Population) | 2.0% | 2.3% |
Similar Demographics by 3rd Grade
Demographics Similar to Nicaraguans by 3rd Grade
In terms of 3rd grade, the demographic groups most similar to Nicaraguans are Immigrants from Haiti (96.7%, a difference of 0.0%), Sri Lankan (96.7%, a difference of 0.0%), Guyanese (96.7%, a difference of 0.020%), Cape Verdean (96.6%, a difference of 0.030%), and Central American Indian (96.7%, a difference of 0.050%).
| Demographics | Rating | Rank | 3rd Grade |
| Immigrants | South Eastern Asia | 0.0 /100 | #300 | Tragic 96.8% |
| Immigrants | Cuba | 0.0 /100 | #301 | Tragic 96.8% |
| Immigrants | Somalia | 0.0 /100 | #302 | Tragic 96.8% |
| Ecuadorians | 0.0 /100 | #303 | Tragic 96.7% |
| Immigrants | Caribbean | 0.0 /100 | #304 | Tragic 96.7% |
| Central American Indians | 0.0 /100 | #305 | Tragic 96.7% |
| Guyanese | 0.0 /100 | #306 | Tragic 96.7% |
| Nicaraguans | 0.0 /100 | #307 | Tragic 96.7% |
| Immigrants | Haiti | 0.0 /100 | #308 | Tragic 96.7% |
| Sri Lankans | 0.0 /100 | #309 | Tragic 96.7% |
| Cape Verdeans | 0.0 /100 | #310 | Tragic 96.6% |
| Immigrants | Guyana | 0.0 /100 | #311 | Tragic 96.6% |
| Immigrants | Laos | 0.0 /100 | #312 | Tragic 96.6% |
| Immigrants | Ecuador | 0.0 /100 | #313 | Tragic 96.6% |
| Belizeans | 0.0 /100 | #314 | Tragic 96.6% |
Demographics Similar to Immigrants from Fiji by 3rd Grade
In terms of 3rd grade, the demographic groups most similar to Immigrants from Fiji are Immigrants from Cambodia (96.2%, a difference of 0.020%), Immigrants from Dominican Republic (96.2%, a difference of 0.020%), Mexican (96.2%, a difference of 0.030%), Immigrants from Latin America (96.2%, a difference of 0.040%), and Immigrants from Cabo Verde (96.2%, a difference of 0.040%).
| Demographics | Rating | Rank | 3rd Grade |
| Immigrants | Vietnam | 0.0 /100 | #326 | Tragic 96.4% |
| Japanese | 0.0 /100 | #327 | Tragic 96.4% |
| Bangladeshis | 0.0 /100 | #328 | Tragic 96.3% |
| Immigrants | Honduras | 0.0 /100 | #329 | Tragic 96.3% |
| Immigrants | Armenia | 0.0 /100 | #330 | Tragic 96.3% |
| Immigrants | Latin America | 0.0 /100 | #331 | Tragic 96.2% |
| Mexicans | 0.0 /100 | #332 | Tragic 96.2% |
| Immigrants | Fiji | 0.0 /100 | #333 | Tragic 96.2% |
| Immigrants | Cambodia | 0.0 /100 | #334 | Tragic 96.2% |
| Immigrants | Dominican Republic | 0.0 /100 | #335 | Tragic 96.2% |
| Immigrants | Cabo Verde | 0.0 /100 | #336 | Tragic 96.2% |
| Central Americans | 0.0 /100 | #337 | Tragic 96.1% |
| Guatemalans | 0.0 /100 | #338 | Tragic 96.0% |
| Yakama | 0.0 /100 | #339 | Tragic 95.9% |
| Nepalese | 0.0 /100 | #340 | Tragic 95.9% |