Kenyan vs Immigrants from Bahamas Female Poverty Among 25-34 Year Olds
COMPARE
Kenyan
Immigrants from Bahamas
Female Poverty Among 25-34 Year Olds
Female Poverty Among 25-34 Year Olds Comparison
Kenyans
Immigrants from Bahamas
13.5%
FEMALE POVERTY AMONG 25-34 YEAR OLDS
51.8/ 100
METRIC RATING
173rd/ 347
METRIC RANK
16.3%
FEMALE POVERTY AMONG 25-34 YEAR OLDS
0.0/ 100
METRIC RATING
285th/ 347
METRIC RANK
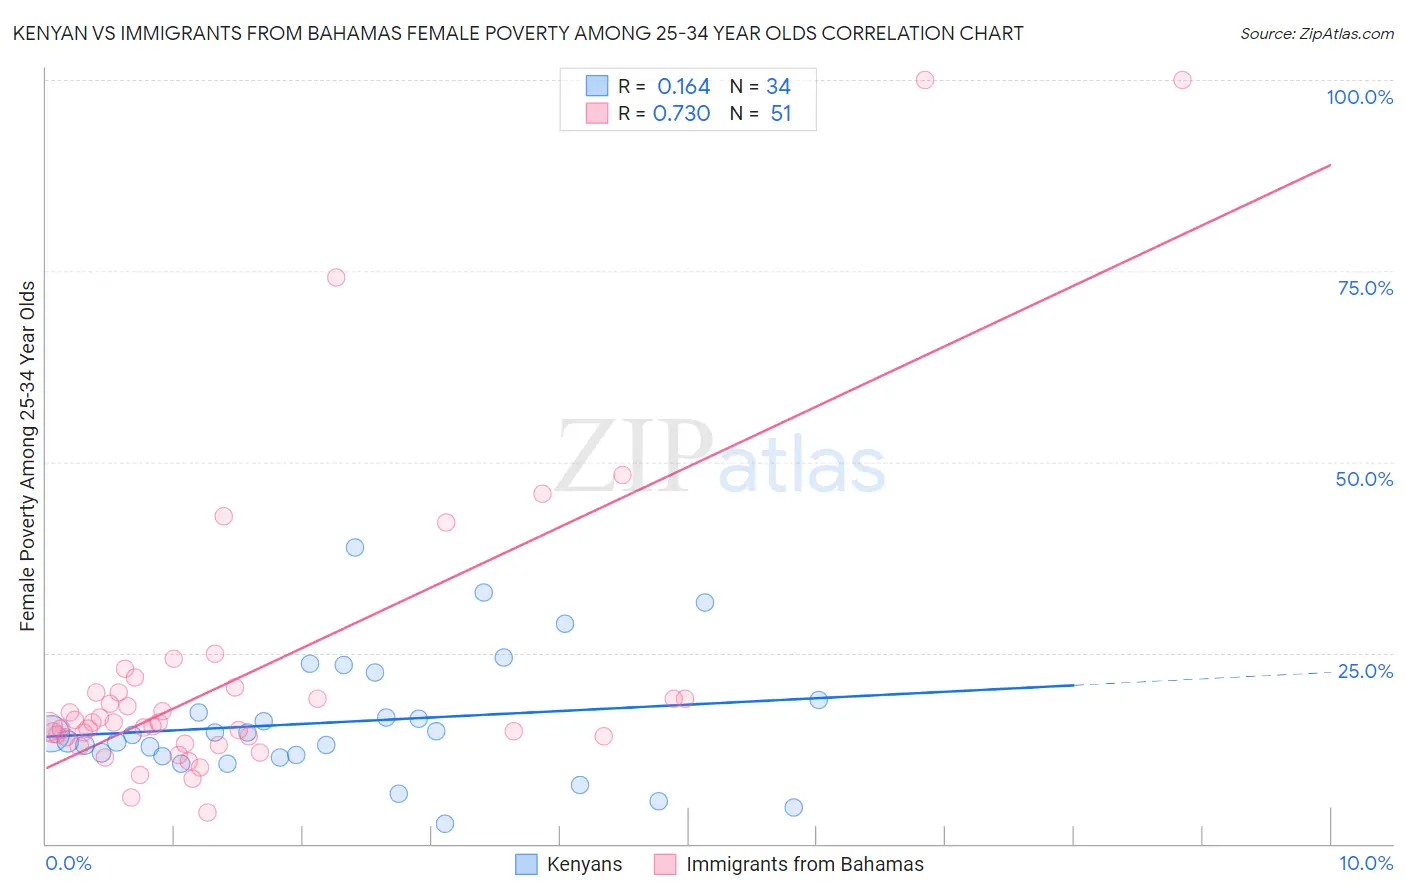
Kenyan vs Immigrants from Bahamas Female Poverty Among 25-34 Year Olds Correlation Chart
The statistical analysis conducted on geographies consisting of 167,556,876 people shows a poor positive correlation between the proportion of Kenyans and poverty level among females between the ages 25 and 34 in the United States with a correlation coefficient (R) of 0.164 and weighted average of 13.5%. Similarly, the statistical analysis conducted on geographies consisting of 104,297,091 people shows a strong positive correlation between the proportion of Immigrants from Bahamas and poverty level among females between the ages 25 and 34 in the United States with a correlation coefficient (R) of 0.730 and weighted average of 16.3%, a difference of 20.7%.
Female Poverty Among 25-34 Year Olds Correlation Summary
| Measurement | Kenyan | Immigrants from Bahamas |
| Minimum | 2.6% | 4.0% |
| Maximum | 38.8% | 100.0% |
| Range | 36.2% | 96.0% |
| Mean | 16.0% | 22.1% |
| Median | 14.3% | 15.8% |
| Interquartile 25% (IQ1) | 11.4% | 13.9% |
| Interquartile 75% (IQ3) | 18.8% | 19.9% |
| Interquartile Range (IQR) | 7.3% | 5.9% |
| Standard Deviation (Sample) | 8.2% | 19.9% |
| Standard Deviation (Population) | 8.1% | 19.7% |
Similar Demographics by Female Poverty Among 25-34 Year Olds
Demographics Similar to Kenyans by Female Poverty Among 25-34 Year Olds
In terms of female poverty among 25-34 year olds, the demographic groups most similar to Kenyans are South American Indian (13.5%, a difference of 0.010%), Immigrants from Costa Rica (13.5%, a difference of 0.010%), Immigrants from Uganda (13.5%, a difference of 0.10%), Immigrants from Oceania (13.5%, a difference of 0.15%), and Bermudan (13.6%, a difference of 0.41%).
| Demographics | Rating | Rank | Female Poverty Among 25-34 Year Olds |
| Belgians | 58.9 /100 | #166 | Average 13.4% |
| Immigrants | Bosnia and Herzegovina | 58.6 /100 | #167 | Average 13.4% |
| Immigrants | Afghanistan | 57.7 /100 | #168 | Average 13.4% |
| Samoans | 56.8 /100 | #169 | Average 13.5% |
| Immigrants | Uganda | 53.0 /100 | #170 | Average 13.5% |
| South American Indians | 51.9 /100 | #171 | Average 13.5% |
| Immigrants | Costa Rica | 51.9 /100 | #172 | Average 13.5% |
| Kenyans | 51.8 /100 | #173 | Average 13.5% |
| Immigrants | Oceania | 50.0 /100 | #174 | Average 13.5% |
| Bermudans | 46.8 /100 | #175 | Average 13.6% |
| Yugoslavians | 45.0 /100 | #176 | Average 13.6% |
| Venezuelans | 44.6 /100 | #177 | Average 13.6% |
| Canadians | 44.3 /100 | #178 | Average 13.6% |
| Immigrants | Eastern Africa | 43.6 /100 | #179 | Average 13.6% |
| Germans | 41.6 /100 | #180 | Average 13.6% |
Demographics Similar to Immigrants from Bahamas by Female Poverty Among 25-34 Year Olds
In terms of female poverty among 25-34 year olds, the demographic groups most similar to Immigrants from Bahamas are Cape Verdean (16.3%, a difference of 0.18%), American (16.4%, a difference of 0.23%), Guatemalan (16.4%, a difference of 0.42%), Osage (16.4%, a difference of 0.48%), and Shoshone (16.2%, a difference of 0.50%).
| Demographics | Rating | Rank | Female Poverty Among 25-34 Year Olds |
| French American Indians | 0.0 /100 | #278 | Tragic 15.9% |
| Fijians | 0.0 /100 | #279 | Tragic 15.9% |
| Bangladeshis | 0.0 /100 | #280 | Tragic 15.9% |
| Immigrants | Latin America | 0.0 /100 | #281 | Tragic 16.0% |
| Aleuts | 0.0 /100 | #282 | Tragic 16.1% |
| Bahamians | 0.0 /100 | #283 | Tragic 16.1% |
| Shoshone | 0.0 /100 | #284 | Tragic 16.2% |
| Immigrants | Bahamas | 0.0 /100 | #285 | Tragic 16.3% |
| Cape Verdeans | 0.0 /100 | #286 | Tragic 16.3% |
| Americans | 0.0 /100 | #287 | Tragic 16.4% |
| Guatemalans | 0.0 /100 | #288 | Tragic 16.4% |
| Osage | 0.0 /100 | #289 | Tragic 16.4% |
| Indonesians | 0.0 /100 | #290 | Tragic 16.4% |
| Comanche | 0.0 /100 | #291 | Tragic 16.5% |
| Immigrants | Dominica | 0.0 /100 | #292 | Tragic 16.5% |