Tsimshian vs Immigrants from Bahamas 7th Grade
COMPARE
Tsimshian
Immigrants from Bahamas
7th Grade
7th Grade Comparison
Tsimshian
Immigrants from Bahamas
97.8%
7TH GRADE
100.0/ 100
METRIC RATING
6th/ 347
METRIC RANK
95.9%
7TH GRADE
30.8/ 100
METRIC RATING
193rd/ 347
METRIC RANK
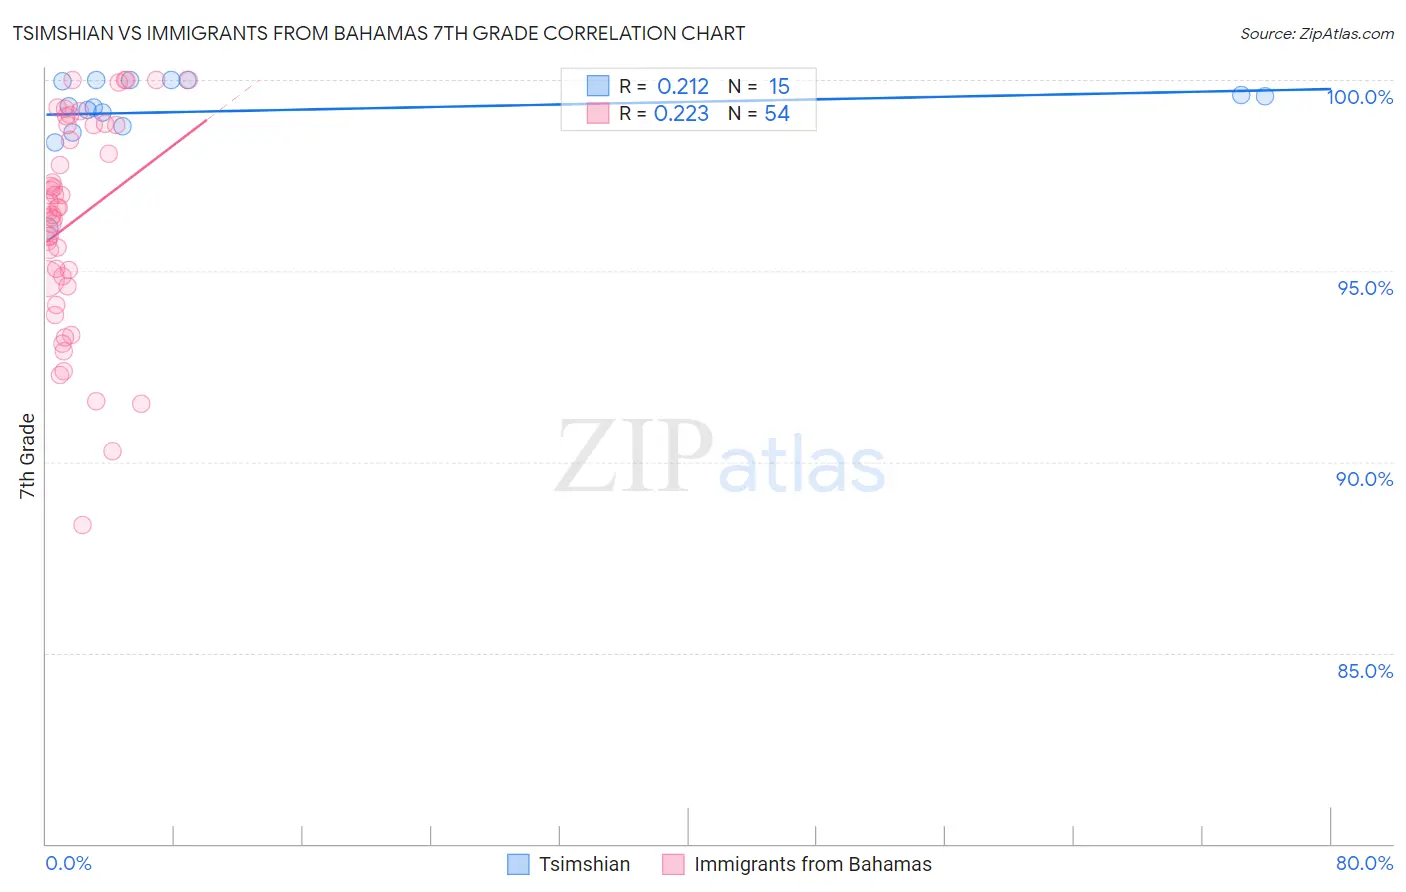
Tsimshian vs Immigrants from Bahamas 7th Grade Correlation Chart
The statistical analysis conducted on geographies consisting of 15,626,544 people shows a weak positive correlation between the proportion of Tsimshian and percentage of population with at least 7th grade education in the United States with a correlation coefficient (R) of 0.212 and weighted average of 97.8%. Similarly, the statistical analysis conducted on geographies consisting of 104,666,801 people shows a weak positive correlation between the proportion of Immigrants from Bahamas and percentage of population with at least 7th grade education in the United States with a correlation coefficient (R) of 0.223 and weighted average of 95.9%, a difference of 2.0%.
7th Grade Correlation Summary
| Measurement | Tsimshian | Immigrants from Bahamas |
| Minimum | 96.1% | 88.3% |
| Maximum | 100.0% | 100.0% |
| Range | 3.9% | 11.7% |
| Mean | 99.2% | 96.3% |
| Median | 99.3% | 96.6% |
| Interquartile 25% (IQ1) | 98.8% | 94.8% |
| Interquartile 75% (IQ3) | 100.0% | 98.8% |
| Interquartile Range (IQR) | 1.2% | 4.0% |
| Standard Deviation (Sample) | 1.0% | 2.8% |
| Standard Deviation (Population) | 0.97% | 2.7% |
Similar Demographics by 7th Grade
Demographics Similar to Tsimshian by 7th Grade
In terms of 7th grade, the demographic groups most similar to Tsimshian are Norwegian (97.8%, a difference of 0.030%), Slovak (97.8%, a difference of 0.040%), Dutch (97.9%, a difference of 0.060%), German (97.7%, a difference of 0.060%), and Slovene (97.6%, a difference of 0.16%).
| Demographics | Rating | Rank | 7th Grade |
| Crow | 100.0 /100 | #1 | Exceptional 99.1% |
| Finns | 100.0 /100 | #2 | Exceptional 98.5% |
| Carpatho Rusyns | 100.0 /100 | #3 | Exceptional 98.3% |
| Ottawa | 100.0 /100 | #4 | Exceptional 98.1% |
| Dutch | 100.0 /100 | #5 | Exceptional 97.9% |
| Tsimshian | 100.0 /100 | #6 | Exceptional 97.8% |
| Norwegians | 100.0 /100 | #7 | Exceptional 97.8% |
| Slovaks | 100.0 /100 | #8 | Exceptional 97.8% |
| Germans | 100.0 /100 | #9 | Exceptional 97.7% |
| Slovenes | 100.0 /100 | #10 | Exceptional 97.6% |
| Alaskan Athabascans | 100.0 /100 | #11 | Exceptional 97.6% |
| Poles | 100.0 /100 | #12 | Exceptional 97.6% |
| Swedes | 100.0 /100 | #13 | Exceptional 97.6% |
| Pennsylvania Germans | 100.0 /100 | #14 | Exceptional 97.6% |
| English | 100.0 /100 | #15 | Exceptional 97.6% |
Demographics Similar to Immigrants from Bahamas by 7th Grade
In terms of 7th grade, the demographic groups most similar to Immigrants from Bahamas are Immigrants from Micronesia (95.9%, a difference of 0.010%), Liberian (95.9%, a difference of 0.010%), Panamanian (95.9%, a difference of 0.010%), Immigrants from Nepal (95.9%, a difference of 0.010%), and Immigrants from Egypt (95.9%, a difference of 0.020%).
| Demographics | Rating | Rank | 7th Grade |
| Immigrants | Iraq | 36.1 /100 | #186 | Fair 96.0% |
| Immigrants | Uganda | 36.0 /100 | #187 | Fair 96.0% |
| Immigrants | Egypt | 34.3 /100 | #188 | Fair 95.9% |
| Immigrants | Venezuela | 33.9 /100 | #189 | Fair 95.9% |
| Immigrants | Micronesia | 32.6 /100 | #190 | Fair 95.9% |
| Liberians | 32.5 /100 | #191 | Fair 95.9% |
| Panamanians | 32.3 /100 | #192 | Fair 95.9% |
| Immigrants | Bahamas | 30.8 /100 | #193 | Fair 95.9% |
| Immigrants | Nepal | 30.0 /100 | #194 | Fair 95.9% |
| Sudanese | 28.1 /100 | #195 | Fair 95.9% |
| Apache | 27.6 /100 | #196 | Fair 95.9% |
| Immigrants | Zaire | 26.7 /100 | #197 | Fair 95.9% |
| Paraguayans | 24.8 /100 | #198 | Fair 95.9% |
| Guamanians/Chamorros | 23.5 /100 | #199 | Fair 95.9% |
| Argentineans | 23.2 /100 | #200 | Fair 95.9% |