Immigrants from Costa Rica vs Guyanese Associate's Degree
COMPARE
Immigrants from Costa Rica
Guyanese
Associate's Degree
Associate's Degree Comparison
Immigrants from Costa Rica
Guyanese
45.0%
ASSOCIATE'S DEGREE
16.7/ 100
METRIC RATING
209th/ 347
METRIC RANK
42.3%
ASSOCIATE'S DEGREE
1.0/ 100
METRIC RATING
243rd/ 347
METRIC RANK
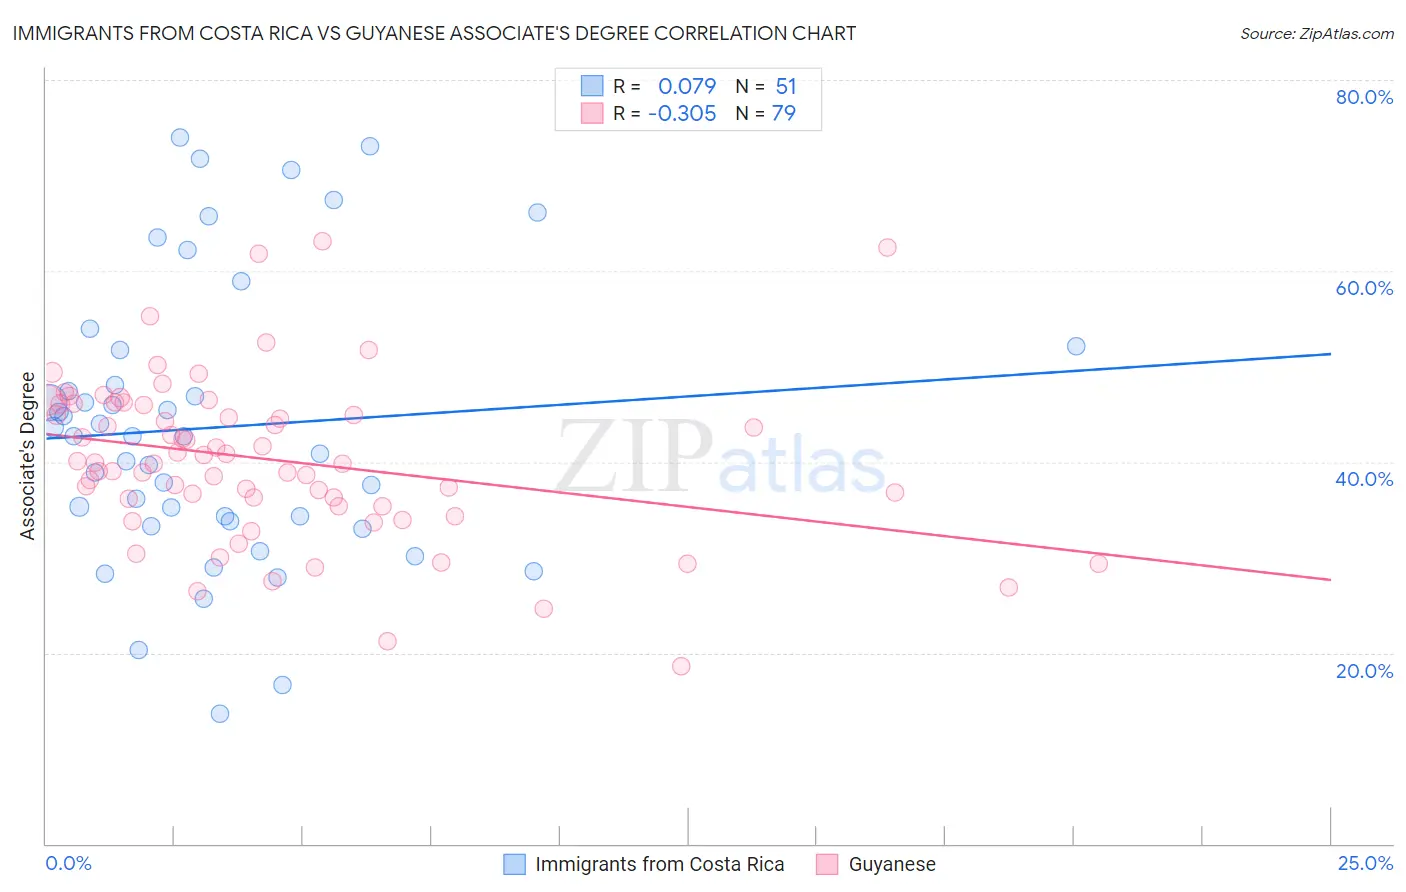
Immigrants from Costa Rica vs Guyanese Associate's Degree Correlation Chart
The statistical analysis conducted on geographies consisting of 204,274,637 people shows a slight positive correlation between the proportion of Immigrants from Costa Rica and percentage of population with at least associate's degree education in the United States with a correlation coefficient (R) of 0.079 and weighted average of 45.0%. Similarly, the statistical analysis conducted on geographies consisting of 176,923,835 people shows a mild negative correlation between the proportion of Guyanese and percentage of population with at least associate's degree education in the United States with a correlation coefficient (R) of -0.305 and weighted average of 42.3%, a difference of 6.2%.
Associate's Degree Correlation Summary
| Measurement | Immigrants from Costa Rica | Guyanese |
| Minimum | 13.6% | 18.6% |
| Maximum | 74.0% | 63.1% |
| Range | 60.4% | 44.5% |
| Mean | 43.6% | 40.2% |
| Median | 42.6% | 39.9% |
| Interquartile 25% (IQ1) | 33.8% | 35.4% |
| Interquartile 75% (IQ3) | 51.7% | 46.0% |
| Interquartile Range (IQR) | 17.9% | 10.6% |
| Standard Deviation (Sample) | 14.7% | 8.5% |
| Standard Deviation (Population) | 14.5% | 8.5% |
Similar Demographics by Associate's Degree
Demographics Similar to Immigrants from Costa Rica by Associate's Degree
In terms of associate's degree, the demographic groups most similar to Immigrants from Costa Rica are Immigrants from Philippines (45.0%, a difference of 0.010%), Immigrants from Zaire (45.0%, a difference of 0.010%), Dutch (45.0%, a difference of 0.11%), Panamanian (45.1%, a difference of 0.22%), and French Canadian (44.9%, a difference of 0.25%).
| Demographics | Rating | Rank | Associate's Degree |
| Spaniards | 20.4 /100 | #202 | Fair 45.2% |
| Immigrants | South Eastern Asia | 20.2 /100 | #203 | Fair 45.2% |
| Nigerians | 19.1 /100 | #204 | Poor 45.1% |
| Immigrants | Thailand | 18.9 /100 | #205 | Poor 45.1% |
| German Russians | 18.9 /100 | #206 | Poor 45.1% |
| Panamanians | 18.4 /100 | #207 | Poor 45.1% |
| Dutch | 17.6 /100 | #208 | Poor 45.0% |
| Immigrants | Costa Rica | 16.7 /100 | #209 | Poor 45.0% |
| Immigrants | Philippines | 16.7 /100 | #210 | Poor 45.0% |
| Immigrants | Zaire | 16.6 /100 | #211 | Poor 45.0% |
| French Canadians | 15.0 /100 | #212 | Poor 44.9% |
| Immigrants | Ghana | 14.2 /100 | #213 | Poor 44.8% |
| Immigrants | Middle Africa | 12.7 /100 | #214 | Poor 44.7% |
| Immigrants | Panama | 12.4 /100 | #215 | Poor 44.7% |
| Immigrants | Nigeria | 11.4 /100 | #216 | Poor 44.6% |
Demographics Similar to Guyanese by Associate's Degree
In terms of associate's degree, the demographic groups most similar to Guyanese are Immigrants from West Indies (42.4%, a difference of 0.11%), British West Indian (42.4%, a difference of 0.12%), Immigrants from Liberia (42.3%, a difference of 0.14%), Immigrants from Cambodia (42.3%, a difference of 0.16%), and Delaware (42.3%, a difference of 0.19%).
| Demographics | Rating | Rank | Associate's Degree |
| Immigrants | St. Vincent and the Grenadines | 1.9 /100 | #236 | Tragic 42.9% |
| Immigrants | Nonimmigrants | 1.9 /100 | #237 | Tragic 42.9% |
| Iroquois | 1.7 /100 | #238 | Tragic 42.8% |
| Immigrants | Grenada | 1.3 /100 | #239 | Tragic 42.6% |
| Cree | 1.2 /100 | #240 | Tragic 42.5% |
| British West Indians | 1.0 /100 | #241 | Tragic 42.4% |
| Immigrants | West Indies | 1.0 /100 | #242 | Tragic 42.4% |
| Guyanese | 1.0 /100 | #243 | Tragic 42.3% |
| Immigrants | Liberia | 0.9 /100 | #244 | Tragic 42.3% |
| Immigrants | Cambodia | 0.9 /100 | #245 | Tragic 42.3% |
| Delaware | 0.9 /100 | #246 | Tragic 42.3% |
| Immigrants | Fiji | 0.8 /100 | #247 | Tragic 42.2% |
| Immigrants | Ecuador | 0.8 /100 | #248 | Tragic 42.2% |
| Jamaicans | 0.7 /100 | #249 | Tragic 42.1% |
| U.S. Virgin Islanders | 0.7 /100 | #250 | Tragic 42.1% |