Croatian vs Bahamian Professional Degree
COMPARE
Croatian
Bahamian
Professional Degree
Professional Degree Comparison
Croatians
Bahamians
4.9%
PROFESSIONAL DEGREE
96.0/ 100
METRIC RATING
118th/ 347
METRIC RANK
3.7%
PROFESSIONAL DEGREE
1.1/ 100
METRIC RATING
257th/ 347
METRIC RANK
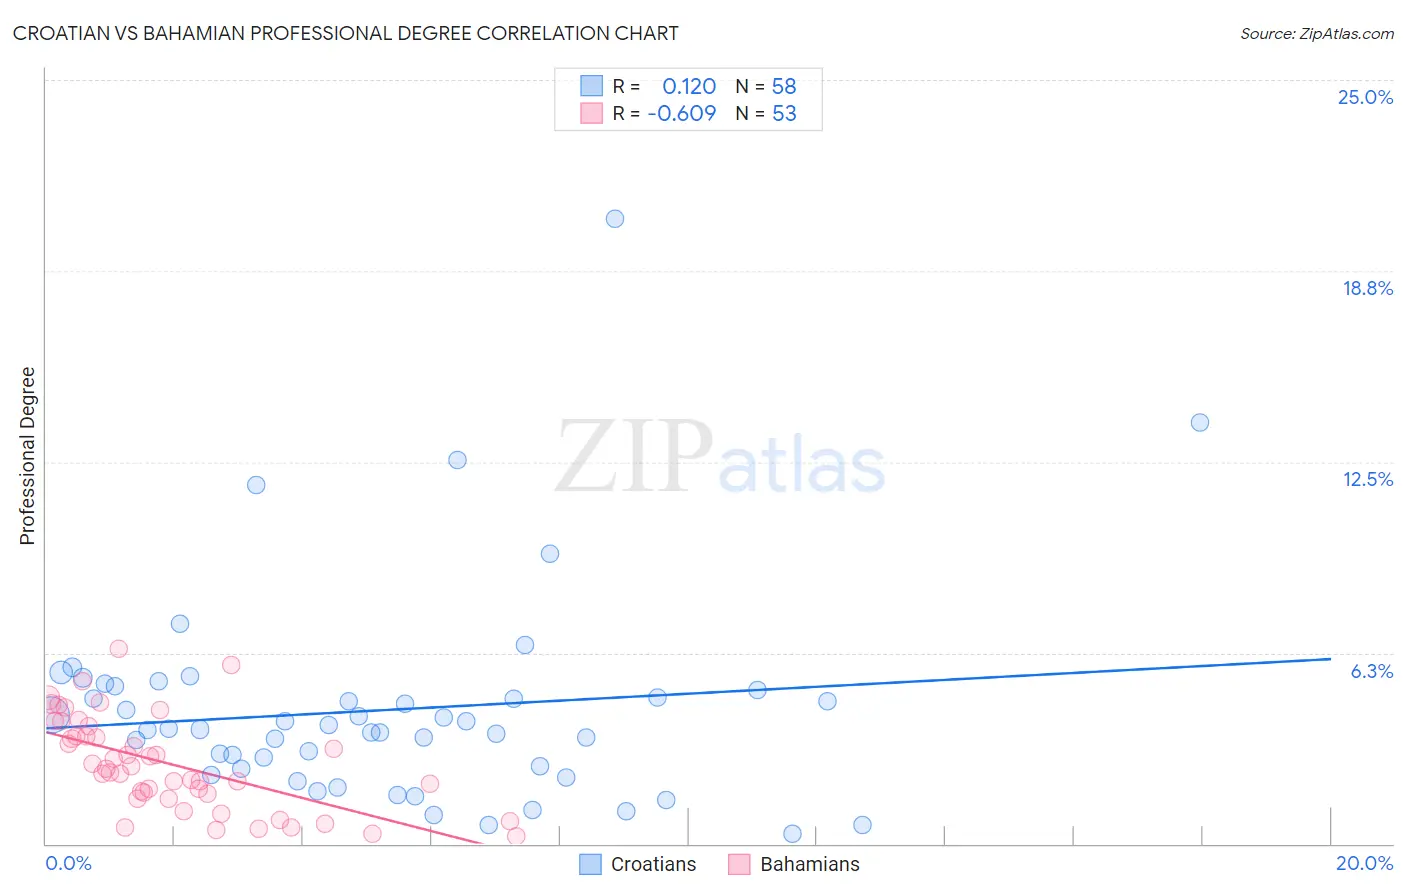
Croatian vs Bahamian Professional Degree Correlation Chart
The statistical analysis conducted on geographies consisting of 374,896,784 people shows a poor positive correlation between the proportion of Croatians and percentage of population with at least professional degree education in the United States with a correlation coefficient (R) of 0.120 and weighted average of 4.9%. Similarly, the statistical analysis conducted on geographies consisting of 112,564,852 people shows a significant negative correlation between the proportion of Bahamians and percentage of population with at least professional degree education in the United States with a correlation coefficient (R) of -0.609 and weighted average of 3.7%, a difference of 33.5%.
Professional Degree Correlation Summary
| Measurement | Croatian | Bahamian |
| Minimum | 0.32% | 0.24% |
| Maximum | 20.4% | 6.4% |
| Range | 20.1% | 6.2% |
| Mean | 4.4% | 2.6% |
| Median | 3.8% | 2.5% |
| Interquartile 25% (IQ1) | 2.4% | 1.6% |
| Interquartile 75% (IQ3) | 5.0% | 3.7% |
| Interquartile Range (IQR) | 2.6% | 2.1% |
| Standard Deviation (Sample) | 3.4% | 1.5% |
| Standard Deviation (Population) | 3.4% | 1.5% |
Similar Demographics by Professional Degree
Demographics Similar to Croatians by Professional Degree
In terms of professional degree, the demographic groups most similar to Croatians are Immigrants from Syria (4.9%, a difference of 0.0%), Venezuelan (4.9%, a difference of 0.21%), Immigrants from Sudan (4.9%, a difference of 0.54%), Albanian (4.9%, a difference of 0.55%), and Moroccan (5.0%, a difference of 0.68%).
| Demographics | Rating | Rank | Professional Degree |
| Brazilians | 97.4 /100 | #111 | Exceptional 5.0% |
| Taiwanese | 97.3 /100 | #112 | Exceptional 5.0% |
| Immigrants | Pakistan | 97.2 /100 | #113 | Exceptional 5.0% |
| Immigrants | Morocco | 96.8 /100 | #114 | Exceptional 5.0% |
| Moroccans | 96.8 /100 | #115 | Exceptional 5.0% |
| Venezuelans | 96.3 /100 | #116 | Exceptional 4.9% |
| Immigrants | Syria | 96.0 /100 | #117 | Exceptional 4.9% |
| Croatians | 96.0 /100 | #118 | Exceptional 4.9% |
| Immigrants | Sudan | 95.4 /100 | #119 | Exceptional 4.9% |
| Albanians | 95.3 /100 | #120 | Exceptional 4.9% |
| Immigrants | Moldova | 94.8 /100 | #121 | Exceptional 4.9% |
| Immigrants | Germany | 94.1 /100 | #122 | Exceptional 4.9% |
| Immigrants | Venezuela | 93.8 /100 | #123 | Exceptional 4.8% |
| Immigrants | Eritrea | 93.5 /100 | #124 | Exceptional 4.8% |
| Immigrants | Albania | 93.3 /100 | #125 | Exceptional 4.8% |
Demographics Similar to Bahamians by Professional Degree
In terms of professional degree, the demographic groups most similar to Bahamians are Immigrants from St. Vincent and the Grenadines (3.7%, a difference of 0.080%), African (3.7%, a difference of 0.30%), Indonesian (3.7%, a difference of 0.31%), Iroquois (3.7%, a difference of 0.37%), and Osage (3.7%, a difference of 0.47%).
| Demographics | Rating | Rank | Professional Degree |
| Immigrants | Fiji | 1.5 /100 | #250 | Tragic 3.7% |
| Immigrants | Nicaragua | 1.4 /100 | #251 | Tragic 3.7% |
| Jamaicans | 1.4 /100 | #252 | Tragic 3.7% |
| Pueblo | 1.4 /100 | #253 | Tragic 3.7% |
| Tongans | 1.3 /100 | #254 | Tragic 3.7% |
| Osage | 1.2 /100 | #255 | Tragic 3.7% |
| Iroquois | 1.2 /100 | #256 | Tragic 3.7% |
| Bahamians | 1.1 /100 | #257 | Tragic 3.7% |
| Immigrants | St. Vincent and the Grenadines | 1.1 /100 | #258 | Tragic 3.7% |
| Africans | 1.0 /100 | #259 | Tragic 3.7% |
| Indonesians | 1.0 /100 | #260 | Tragic 3.7% |
| Immigrants | Guyana | 1.0 /100 | #261 | Tragic 3.7% |
| U.S. Virgin Islanders | 1.0 /100 | #262 | Tragic 3.7% |
| Hopi | 0.9 /100 | #263 | Tragic 3.6% |
| Immigrants | Cambodia | 0.9 /100 | #264 | Tragic 3.6% |